Testing Your Network Speed On macOS From The Terminal
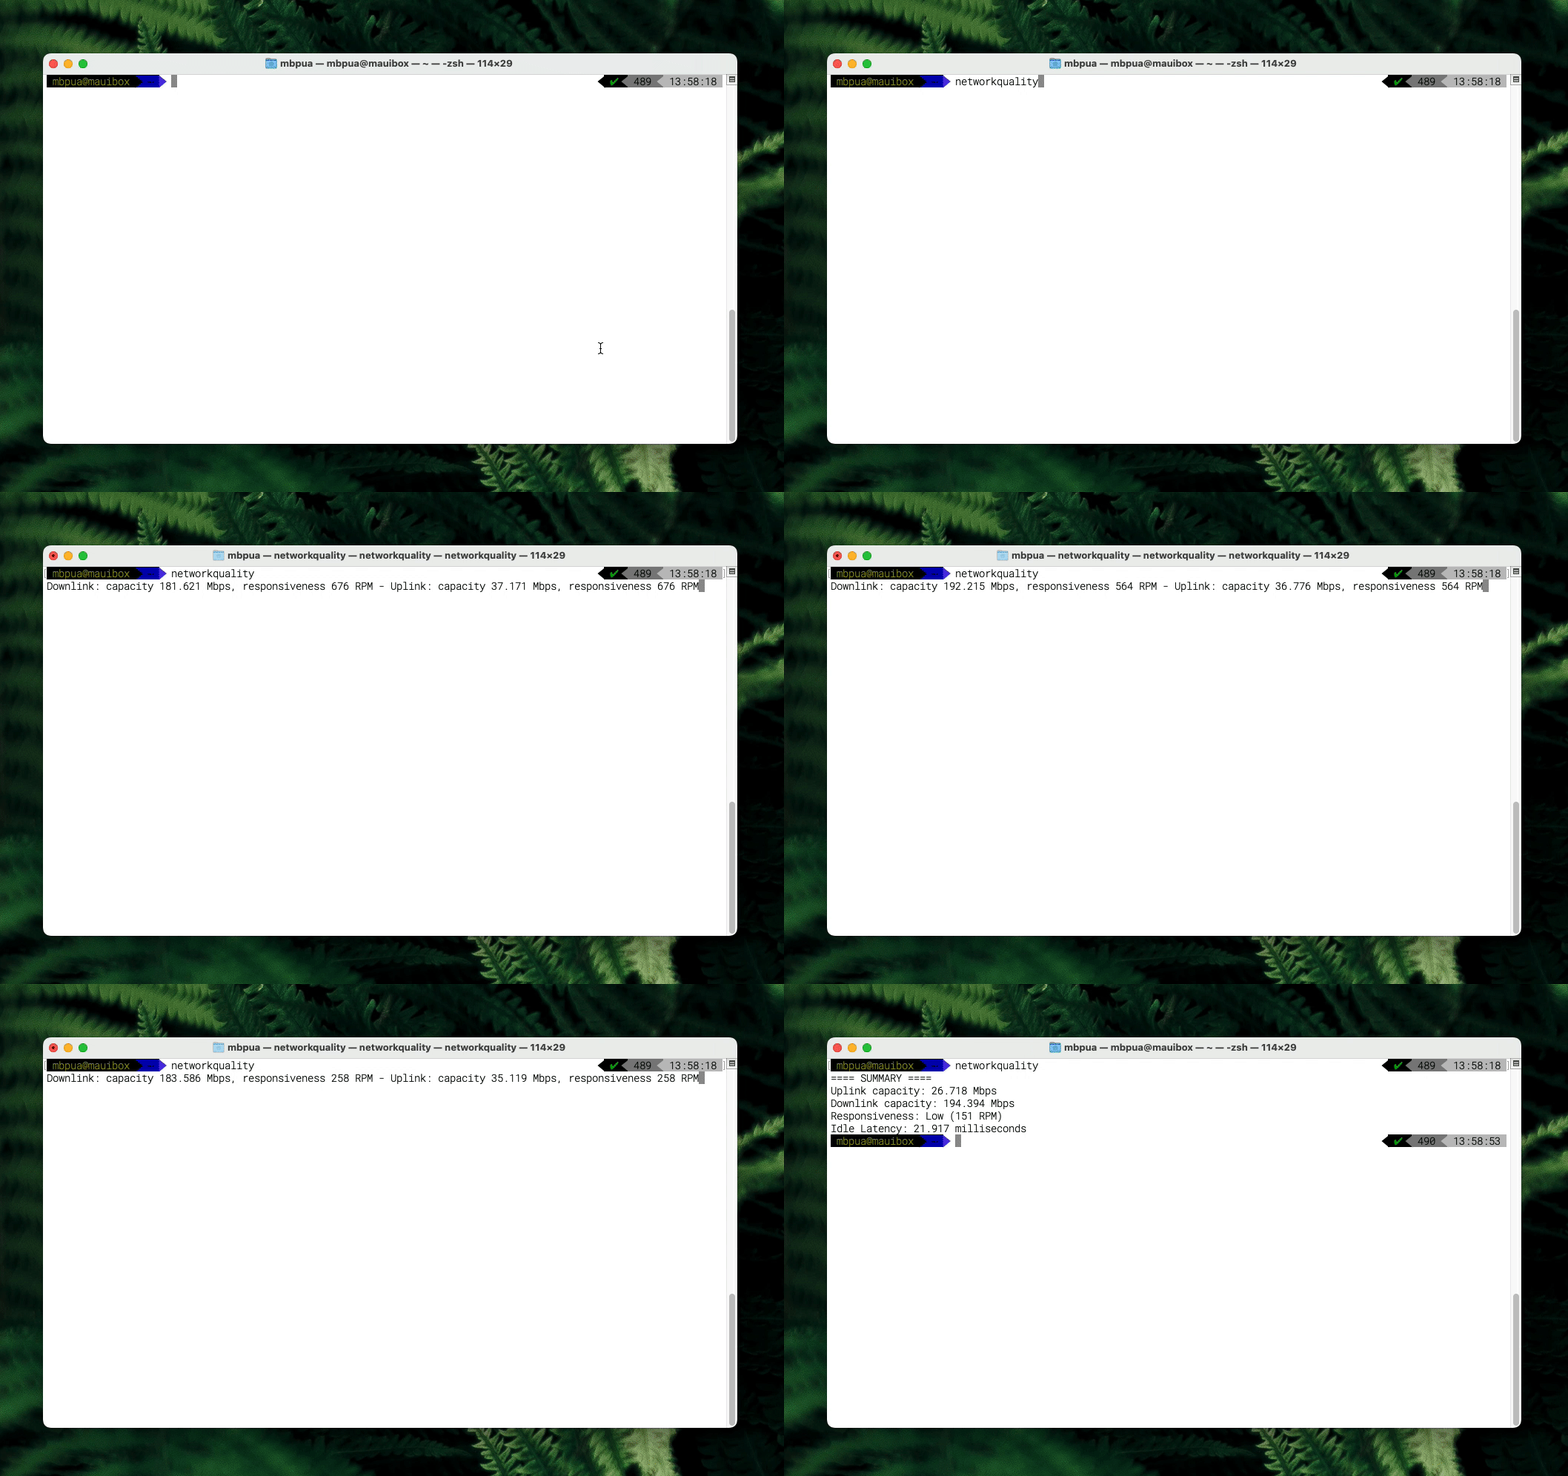
Starting with macOS Monterrey (released all the way back in 2021) a nifty little utility is bundled with the operating system - networkquality. For whatever reason, Apple doesn’t really document it anywhere outside a lone support article. This allows any macOS user to conveniently run speed tests right in the comfort of their Terminal by executing the following command:
networkquality
After running a short test, you’ll get a human-readable version of the results, something like this:
==== SUMMARY ====
Uplink capacity: 26.718 Mbps
Downlink capacity: 194.394 Mbps
Responsiveness: Low (151 RPM)
Idle Latency: 21.917 milliseconds

networkquality utility in macOS Terminal.This is great and all, but if you’d want to automate speed tests and log the data in, say, a SQLite database locally, then parsing the output above would be a hassle. Maybe not so much hassle with regular expressions, but a hassle nonetheless. What if you got the same results in a computer-readable format, like JSON? Run the following:
networkquality -c
You should get an output similar to this:
{
  "base_rtt" : 24.5,
  "dl_flows" : 16,
  "dl_throughput" : 216102304,
  "end_date" : "10/12/23, 2:15:48 PM",
  "il_h2_req_resp" : [
    23,
    14,
    17,
    21,
    19,
    21,
    15,
    25
  ],
  "il_tcp_handshake_443" : [
    13,
    18,
    19,
    19,
    18,
    18,
    20,
    16
  ],
  "il_tls_handshake" : [
    26,
    29,
    31,
    35,
    37,
    40,
    45,
    49
  ],
  "interface_name" : "en0",
  "lud_foreign_h2_req_resp" : [
    61,
    57,
    26,
    48,
    57,
    113,
    [...MORE DATA HERE...]
  ],
  "lud_foreign_tcp_handshake_443" : [
    27,
    35,
    37,
    48,
    48,
    47,
    [...MORE DATA HERE...]
  ],
  "lud_foreign_tls_handshake" : [
    32,
    50,
    89,
    83,
    58,
    100,
    [...MORE DATA HERE...]
  ],
  "lud_self_h2_req_resp" : [
    107,
    68,
    112,
    77,
    79,
    148,
    [...MORE DATA HERE...]
  ],
  "os_version" : "Version 13.5.1 (Build 22G90)",
  "responsiveness" : 69,
  "start_date" : "10/12/23, 2:15:36 PM",
  "ul_flows" : 8,
  "ul_throughput" : 13173327
}
The field values are posted here for reference since not everyone wants to run man networkQuality (capitalization is important) and read docs in the terminal:
| JSON value | Description |
|---|---|
base_rtt |
The calculated idle latency of the test run (in milliseconds). |
dl_flows |
Number of download flows initiated. |
dl_throughput |
The measured downlink throughput (in bytes per second). |
end_date |
Time when test run was completed (in local time). |
il_h2_req_resp |
The idle-latency Request/Response times for HTTP/2 (in milliseconds). |
il_tcp_handshake_443 |
The idle-latency TCP-handshake times (in milliseconds). |
il_tls_handshake |
The idle-latency TLS-handshake times (in milliseconds). |
interface_name |
Interface name in which the test ran against. |
lud_foreign_h2_req_resp |
Combined upload/download latency-under-load request/response times for HTTP/2 (in milliseconds). Only available when -s is not specified. |
lud_foreign_tcp_handshake_443 |
Combined upload/download latency-under-load for for TCP-handshake times (in milliseconds). Only available when -s is not specified. |
lud_foreign_tls_handshake |
Combined foreign upload/download latency-under-load for for TLS-handshake times (in milliseconds). Only available when -s is not specified. |
lud_self_h2_req_resp |
Combined self upload/download latency-under-load request/response times for HTTP/2 (in milliseconds). Only available when -s is not specified. |
os_version |
The version of the OS the test was run on. |
responsiveness |
The responsiveness score (in RPM). The combined value if -c is not specified. |
start_date |
Time when test run was started (in local time). |
ul_flows |
Number of upload flows created. |
ul_throughput |
The measured uplink throughput (in bytes per second). |
What’s great about the data in the JSON blob is that it comes “clean” - that is, you get an array of integers that you can easily pass to any chart visualization tooling, like the one I am using in this blog, and have it rendered right away:
On my macOS boxes, I run this via a cron to take snapshots and store them in a local SQLite database. I created a new database with the following command:
sqlite3 test.db "CREATE TABLE SpeedMetadata ( ResponseBody TEXT, BaseRtt Text GENERATED ALWAYS AS (json_extract(ResponseBody, '$.base_rtt')) VIRTUAL, DLFlows Text GENERATED ALWAYS AS (json_extract(ResponseBody, '$.dl_flows')) VIRTUAL, DLThroughput Text GENERATED ALWAYS AS (json_extract(ResponseBody, '$.dl_throughput')) VIRTUAL, EndDate DATETIME GENERATED ALWAYS AS (json_extract(ResponseBody, '$.end_date')) VIRTUAL, ILH2ReqResp Text GENERATED ALWAYS AS (json_extract(ResponseBody, '$.il_h2_req_resp')) VIRTUAL, ILTCPHandshake443 Text GENERATED ALWAYS AS (json_extract(ResponseBody, '$.il_tcp_handshake_443')) VIRTUAL, ILTLSHandshake Text GENERATED ALWAYS AS (json_extract(ResponseBody, '$.il_tls_handshake')) VIRTUAL, InterfaceName Text GENERATED ALWAYS AS (json_extract(ResponseBody, '$.interface_name')) VIRTUAL, LUDForeighH2ReqResp Text GENERATED ALWAYS AS (json_extract(ResponseBody, '$.lud_foreign_h2_req_resp')) VIRTUAL, LUDForeignTCPHandshake443 Text GENERATED ALWAYS AS (json_extract(ResponseBody, '$.lud_foreign_tcp_handshake_443')) VIRTUAL, LUDForeignTLSHandshake Text GENERATED ALWAYS AS (json_extract(ResponseBody, '$.lud_foreign_tls_handshake')) VIRTUAL, LUDSelfH2ReqResp Text GENERATED ALWAYS AS (json_extract(ResponseBody, '$.lud_self_h2_req_resp')) VIRTUAL, OSVersion Text GENERATED ALWAYS AS (json_extract(ResponseBody, '$.os_version')) VIRTUAL, Responsiveness Text GENERATED ALWAYS AS (json_extract(ResponseBody, '$.responsiveness')) VIRTUAL, StartDate DATETIME GENERATED ALWAYS AS (json_extract(ResponseBody, '$.start_date')) VIRTUAL, ULFlows Text GENERATED ALWAYS AS (json_extract(ResponseBody, '$.ul_flows')) VIRTUAL, ULThroughput Text GENERATED ALWAYS AS (json_extract(ResponseBody, '$.ul_throughput')) VIRTUAL );"
This might seem long and scary, but the “beautified” SQL query is pretty simple:
CREATE TABLE SpeedMetadata (
  ResponseBody TEXT,
  BaseRtt Text GENERATED ALWAYS AS (json_extract(ResponseBody, '$.base_rtt')) VIRTUAL,
  DLFlows Text GENERATED ALWAYS AS (json_extract(ResponseBody, '$.dl_flows')) VIRTUAL,
  DLThroughput Text GENERATED ALWAYS AS (json_extract(ResponseBody, '$.dl_throughput')) VIRTUAL,
  EndDate DATETIME GENERATED ALWAYS AS (json_extract(ResponseBody, '$.end_date')) VIRTUAL,
  ILH2ReqResp Text GENERATED ALWAYS AS (json_extract(ResponseBody, '$.il_h2_req_resp')) VIRTUAL,
  ILTCPHandshake443 Text GENERATED ALWAYS AS (json_extract(ResponseBody, '$.il_tcp_handshake_443')) VIRTUAL,
  ILTLSHandshake Text GENERATED ALWAYS AS (json_extract(ResponseBody, '$.il_tls_handshake')) VIRTUAL,
  InterfaceName Text GENERATED ALWAYS AS (json_extract(ResponseBody, '$.interface_name')) VIRTUAL,
  LUDForeighH2ReqResp Text GENERATED ALWAYS AS (json_extract(ResponseBody, '$.lud_foreign_h2_req_resp')) VIRTUAL,
  LUDForeignTCPHandshake443 Text GENERATED ALWAYS AS (json_extract(ResponseBody, '$.lud_foreign_tcp_handshake_443')) VIRTUAL,
  LUDForeignTLSHandshake Text GENERATED ALWAYS AS (json_extract(ResponseBody, '$.lud_foreign_tls_handshake')) VIRTUAL,
  LUDSelfH2ReqResp Text GENERATED ALWAYS AS (json_extract(ResponseBody, '$.lud_self_h2_req_resp')) VIRTUAL,
  OSVersion Text GENERATED ALWAYS AS (json_extract(ResponseBody, '$.os_version')) VIRTUAL,
  Responsiveness Text GENERATED ALWAYS AS (json_extract(ResponseBody, '$.responsiveness')) VIRTUAL,
  StartDate DATETIME GENERATED ALWAYS AS (json_extract(ResponseBody, '$.start_date')) VIRTUAL,
  ULFlows Text GENERATED ALWAYS AS (json_extract(ResponseBody, '$.ul_flows')) VIRTUAL,
  ULThroughput Text GENERATED ALWAYS AS (json_extract(ResponseBody, '$.ul_throughput')) VIRTUAL
);
It creates the SpeedMetadata table, where ResponseBody is the column where I pass the JSON response from networkquality, and all other columns are automatically computed from the JSON properties in the response (yes, SQLite is that flexible).
Insertion can be done with another command:
sqlite3 test.db "insert into SpeedMetadata (ResponseBody) values ('$(networkquality -c)')"
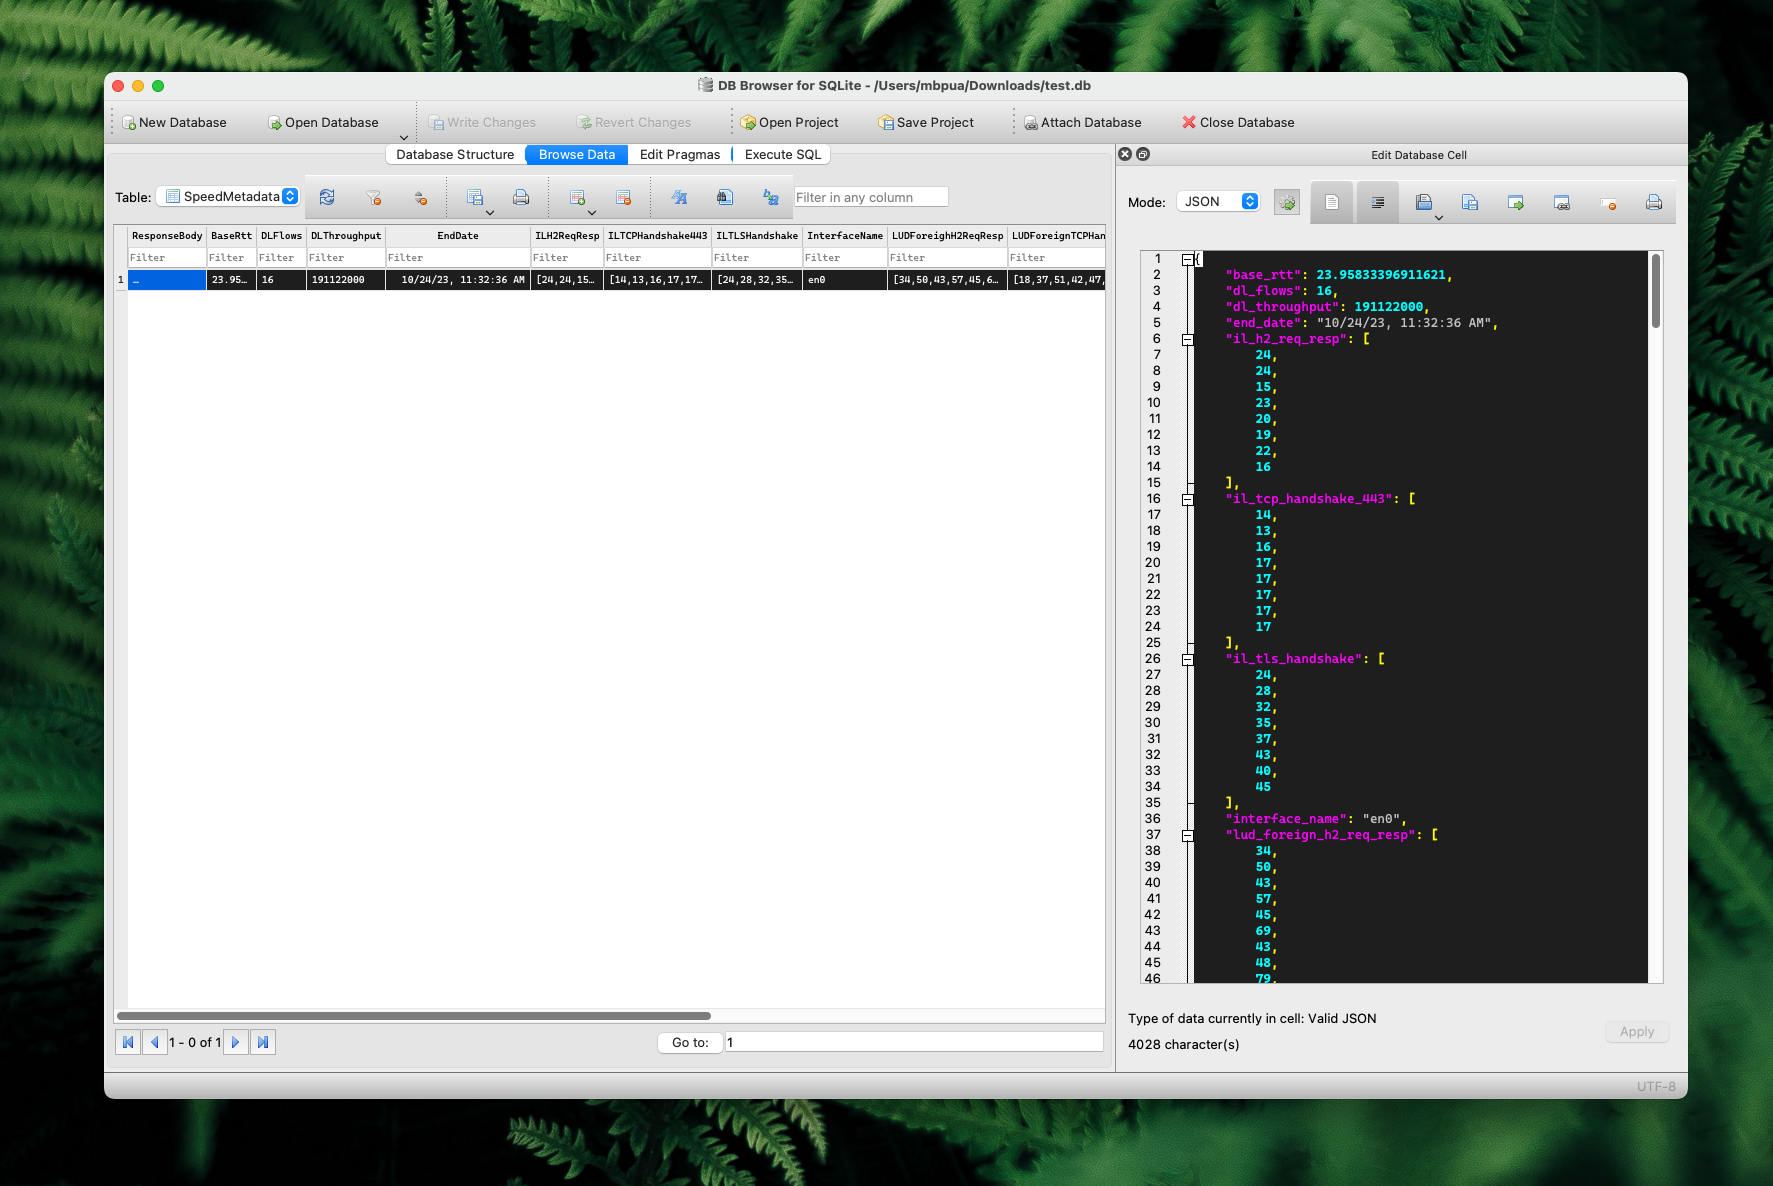
And if we use something like DB Browser for SQLite, we get to see the results logged in the database:

networkquality command in DB Browser for SQLite.Neat little way to actually validate that my ISP’s advertised speed is almost never the speed I actually get and pay for.