Unlocking My Air Data Through API Analysis
Table of Contents
I am naturally curious about the APIs1 that the devices in my house use, so when I got an air quality monitor, one of the first things I did was fiddle with the REST APIs that were made available through the device. As it turns out - more than I expected. In this post, I will discuss the use of an undocumented API, so no warranties are implied - it might stop working tomorrow for all I know.
Contents #
- Overview
- Getting data through app APIs
- Building out custom analysis
- Discovering the web APIs
- Conclusion
Overview #
Let’s get started by taking a look at what device I have, exactly. It’s an IQAir AirVisual Pro2 - a bit on the pricey side, but it gets the job done and has all the data that I need, like CO2 concentration, current AQI3, temperature, humidity, and PM2.5 concentration.
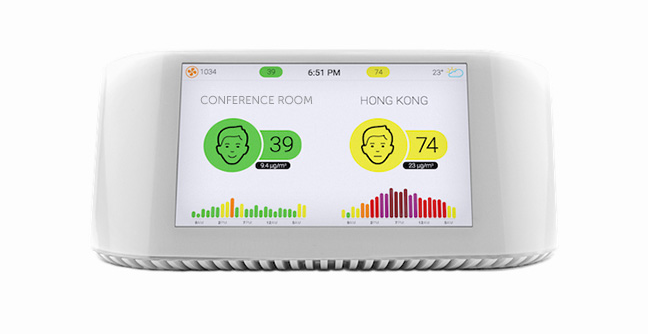
Neat little device, but the application that it comes with, along with the web experience is a bit underwhelming. Mostly because it only shows data for a short period of time, and doesn’t allow any kinds of pivots or transformations, which can be a bit boring. Say I want to know at what hours I have the highest CO2 concentration inside the house, or compare the humidity over time - none of this is an option with the default app or the online service.
If I wanted to go the easiest route, I could explore some of the built-in functionality. The device exposes a SMB share for the data that you can grab if you are on the local network, but that means that I need to boot device off of my guest network and onto my main one, which I don’t want to do. So what’s an engineer to do? Man-in-the-middle the app4 to figure out what servers it talks to, because I just assumed that the data is not only stored locally (there is a joke about Internet of Things here somewhere5).
Getting data through app APIs #
The folks at IQAir seem to have created several branches for their API, and at least two are known to me - the one for the app, and the one for the web interface. By looking at the traffic that originated from my mobile device, I realized that there is an endpoint that can actually channel all the info in one call - all I needed to do was send requests to the following URL:
https://app-api.airvisual.com/api/v5/devices/{device_id}/measurements
The device ID is something you can grab from the device itself or through the app.
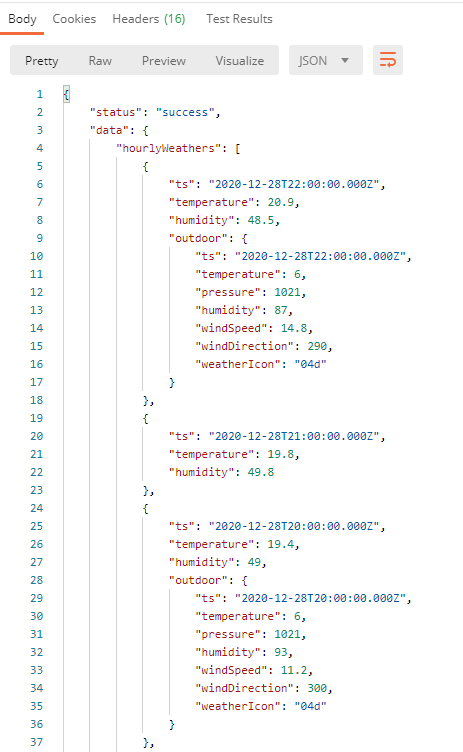
Because with mitmproxy I can also inspect the headers, it was relatively easy to spot that there is a pre-baked x-api-token header that I could grab directly from the app. That is, if I just want to grab the data - but what if the token expires? Is there a way to get a new one? Well, as it turns out, the token is hard-coded into the application (or so it seems), which makes my job that much easier - this means I can just run all the requests I need directly. By using the aforementioned header, I am able to get a JSON representation of the data that originated from my device, along with the comparison information for the location I set the air quality sensor to use as the baseline.
Great, so I am mostly where I want to be. I now can access the data, and ideally store it locally. By accessing the data directly from the service, I can now write a cron job that can take regular snapshots of the environment and place those somewhere. What is somewhere, though?
There could be many choices, including writing everything to a CSV file or maybe even to a document database, if I would need to access the information remotely. For now, however, I just needed to run local analysis, so I opted for SQLite. By using SQLite, I am able to create SQL queries on the data, and slice-and-dice it in a way that makes the most sense for scenarios that I care about right now, or might care about in the future. I could create a very simple table with the help of this SQL snippet:
CREATE TABLE "AirQualityData" (
	"Timestamp"	TEXT,
	"IndoorTemperature"	REAL,
	"IndoorHumidity"	REAL,
	"OutdoorTemperature"	REAL,
	"OutdoorPressure"	REAL,
	"OutdoorHumidity"	REAL,
	"OutdoorWindSpeed"	REAL,
	"OutdoorWindDirection"	REAL,
	"OutdoorWeatherIcon"	TEXT,
	"IndoorPM25AQI"	REAL,
	"IndoorPM25Concentration"	REAL,
	"IndoorCO2Color"	TEXT,
	"IndoorCO2Concentration"	REAL,
	"IndoorPM10AQI"	REAL,
	"IndoorPM10Concentration"	REAL,
	"IndoorPM1AQI"	REAL,
	"IndoorPM1Concentration"	REAL,
	"OutdoorAQI"	REAL,
	"OutdoorPollutant"	TEXT,
	"OutdoorConcentration"	REAL,
	PRIMARY KEY("Timestamp")
);
I could already hear someone being utterly horrified by the fact that I chose the timestamp as the primary key, but worry not - this decision was made based on the fact that the environment data is captured on an hourly basis. What that means is that every entry should technically be unique, and if a new or updated entry is added with the same timestamp, it should just overwrite whatever is already in the database.
The function to store data in this table (written in Python) then becomes very easy because I just need to run a INSERT OR REPLACE statement:
def StoreMeasurements(database_name, measurements):
	data_connection = sqlite3.connect(database_name)

	statement = f'INSERT OR REPLACE INTO AirQualityData (Timestamp, IndoorTemperature, IndoorHumidity, OutdoorTemperature, OutdoorPressure, OutdoorHumidity, OutdoorWindSpeed, OutdoorWindDirection, OutdoorWeatherIcon, IndoorPM25AQI, IndoorPM25Concentration, IndoorCO2Color, IndoorCO2Concentration, IndoorPM10AQI, IndoorPM10Concentration, IndoorPM1AQI, IndoorPM1Concentration, OutdoorAQI, OutdoorPollutant, OutdoorConcentration) VALUES (?, ?, ?, ?, ?, ?, ?, ?, ?, ?, ?, ?, ?, ?, ?, ?, ?, ?, ?, ?)'

	for measurement in measurements:
		pst = pytz.timezone('US/Pacific')

		target_date = dateutil.parser.parse(measurement.timestamp)
		localized_timestamp = target_date.astimezone(pst)

		data_connection.execute(statement, (localized_timestamp.isoformat(), measurement.indoor_temperature, measurement.indoor_humidity, measurement.outdoor_temperature, measurement.outdoor_pressure, measurement.outdoor_humidity, measurement.outdoor_wind_speed,
			measurement.outdoor_wind_direction, measurement.outdoor_weather_icon, measurement.indoor_pm25_aqi, measurement.indoor_pm25_concentration, measurement.indoor_co2_color, measurement.indoor_co2_concentration,
			measurement.indoor_pm10_aqi, measurement.indoor_pm10_concentration, measurement.indoor_pm1_aqi, measurement.indoor_pm1_concentration, measurement.outdoor_aqi, measurement.outdoor_pollutant, measurement.outdoor_concentration))
		data_connection.commit()

	data_connection.close()
Feel free to ignore some timezone changes - the default values returned by the IQAir services are in UTC, and I wanted them stored in PST for ease of processing. You could entirely skip this step, and delegate that work to the future rendering/analysis layer.
With the above, the data acquisition function should be referred to as the “parse a metric crapton of JSON” function that takes the data and places it inside an object:
def GetMeasurementData(api_key, device_id):
	url = f'https://app-api.airvisual.com/api/v5/devices/{device_id}/measurements'

	headers = {
		'x-api-token': api_key
	}

	response = requests.request('GET', url, headers=headers)

	try:
		raw_data = json.loads(response.text)

		measurements = []

		weather_measurements_count = len(raw_data['data']['hourlyWeathers'])
		device_measurements_count = len(raw_data['data']['hourlyMeasurements'])

		print(f'[info] There are {weather_measurements_count} weather measurements.')
		print(f'[info] There are {device_measurements_count} device measurements.')

		measurements = []
		# Ideally, the assumption is that weather measurements are the same number
		# as device measurements. We will test this assumption as the tool is used.
		# In this case, I chose the first array in the returned JSON as the baseline.
		for measurement in raw_data['data']['hourlyWeathers']:
			timestamp = ''
			indoor_temperature = ''
			indoor_humidity = ''
			outdoor_temperature = ''
			outdoor_pressure = ''
			outdoor_humidity = ''
			outdoor_wind_speed = ''
			outdoor_wind_direction = ''
			outdoor_weather_icon = ''
			indoor_pm25_aqi = ''
			indoor_pm25_concentration = ''
			indoor_pm10_aqi = ''
			indoor_pm10_concentration = ''
			indoor_pm1_aqi = ''
			indoor_pm1_concentration = ''
			indoor_co2_color = ''
			indoor_co2_concentration = ''
			outdoor_aqi = ''
			outdoor_concentration = ''
			outdoor_pollutant = ''

			timestamp = measurement['ts']
			indoor_temperature = measurement['temperature']
			indoor_humidity = measurement['humidity']

			if 'outdoor' in measurement:
				outdoor_temperature = measurement['outdoor']['temperature']
				outdoor_pressure = measurement['outdoor']['pressure']
				outdoor_humidity = measurement['outdoor']['humidity']
				outdoor_wind_speed = measurement['outdoor']['windSpeed']
				outdoor_wind_direction = measurement['outdoor']['windDirection']
				outdoor_weather_icon = measurement['outdoor']['weatherIcon']

			device_measurement = [x for x in raw_data['data']['hourlyMeasurements'] if x['ts'] == timestamp][0]

			indoor_pm25_measurement = [x for x in device_measurement['pollutants'] if x['pollutant'].lower() == 'pm25'][0]
			indoor_pm25_aqi = indoor_pm25_measurement['aqius']
			indoor_pm25_concentration = indoor_pm25_measurement['conc']

			indoor_pm10_measurement = [x for x in device_measurement['pollutants'] if x['pollutant'].lower() == 'pm10'][0]
			indoor_pm10_aqi = indoor_pm10_measurement['aqius']
			indoor_pm10_concentration = indoor_pm10_measurement['conc']

			indoor_pm1_measurement = [x for x in device_measurement['pollutants'] if x['pollutant'].lower() == 'pm1'][0]
			indoor_pm1_aqi = indoor_pm1_measurement['aqius']
			indoor_pm1_concentration = indoor_pm1_measurement['conc']

			indoor_co2_measurement = [x for x in device_measurement['pollutants'] if x['pollutant'].lower() == 'co2'][0]
			indoor_co2_color = indoor_co2_measurement['color']
			indoor_co2_concentration = indoor_co2_measurement['conc']

			if 'outdoor' in device_measurement:
				if 'aqius' in device_measurement['outdoor']:
					outdoor_aqi = device_measurement['outdoor']['aqius']
				if 'mainus' in device_measurement['outdoor']:
					outdoor_pollutant = device_measurement['outdoor']['mainus']

				if 'pollutants' in device_measurement['outdoor']:
					outdoor_pollutant_measurement = [x for x in device_measurement['outdoor']['pollutants'] if x['pollutant'].lower() == outdoor_pollutant.lower()][0]
					outdoor_concentration = outdoor_pollutant_measurement['conc']

			key_measurement = mmodel.Measurement(timestamp=timestamp, indoor_temperature=indoor_temperature, indoor_humidity=indoor_humidity, outdoor_temperature=outdoor_temperature, outdoor_pressure=outdoor_pressure,
				outdoor_humidity=outdoor_humidity, outdoor_wind_speed=outdoor_wind_speed, outdoor_wind_direction=outdoor_wind_direction, outdoor_weather_icon=outdoor_weather_icon, indoor_pm25_aqi=indoor_pm25_aqi,
				indoor_pm25_concentration=indoor_pm25_concentration, indoor_co2_color=indoor_co2_color, indoor_co2_concentration=indoor_co2_concentration, indoor_pm10_aqi=indoor_pm10_aqi, indoor_pm10_concentration=indoor_pm10_concentration,
				indoor_pm1_aqi=indoor_pm1_aqi, indoor_pm1_concentration=indoor_pm1_concentration, outdoor_aqi=outdoor_aqi, outdoor_pollutant=outdoor_pollutant, outdoor_concentration=outdoor_concentration)

			measurements.append(key_measurement)

		return measurements
	except Exception as ex:
		exc_type, exc_obj, exc_tb = sys.exc_info()
		print('[error] There was a problem with getting the data.')
		print(f'[error] Exception details: {ex}')
		print(exc_tb.tb_lineno)

		return None
Again, I don’t expect you to dive super deep into the code above, but it gives you an idea of how the data can be read and processed.
Building out custom analysis #
I ran this scheduled job for a couple of days, capturing information in the morning and in the evening, and ended up with a pretty good corpus of data. I could now attempt to render it. Because I need something fast and easily tweakable, I went with a Jupyter notebook, where I can just plug the SQL queries and get the raw output. Like this:
import sqlite3
import pandas as pd
import matplotlib.pyplot as plt
import numpy as np
import seaborn as sns

%matplotlib inline

data_connection = sqlite3.connect("../airdata.db")

statement = f"""
SELECT Timestamp, IndoorTemperature, OutdoorTemperature
FROM AirQualityData
GROUP BY 1
ORDER BY 1 ASC
"""

df = pd.read_sql_query(statement, data_connection)
df['OutdoorTemperature'] = pd.to_numeric(df.OutdoorTemperature)

plt.figure(figsize=(20,10))
plt.xticks(rotation='vertical')
plt.plot(df.Timestamp, df.IndoorTemperature)
plt.plot(df.Timestamp, df.OutdoorTemperature)
This would give me a very nice graph (X axis aside), allowing me to compare the indoor and outdoor temperature over more than just 7 days:
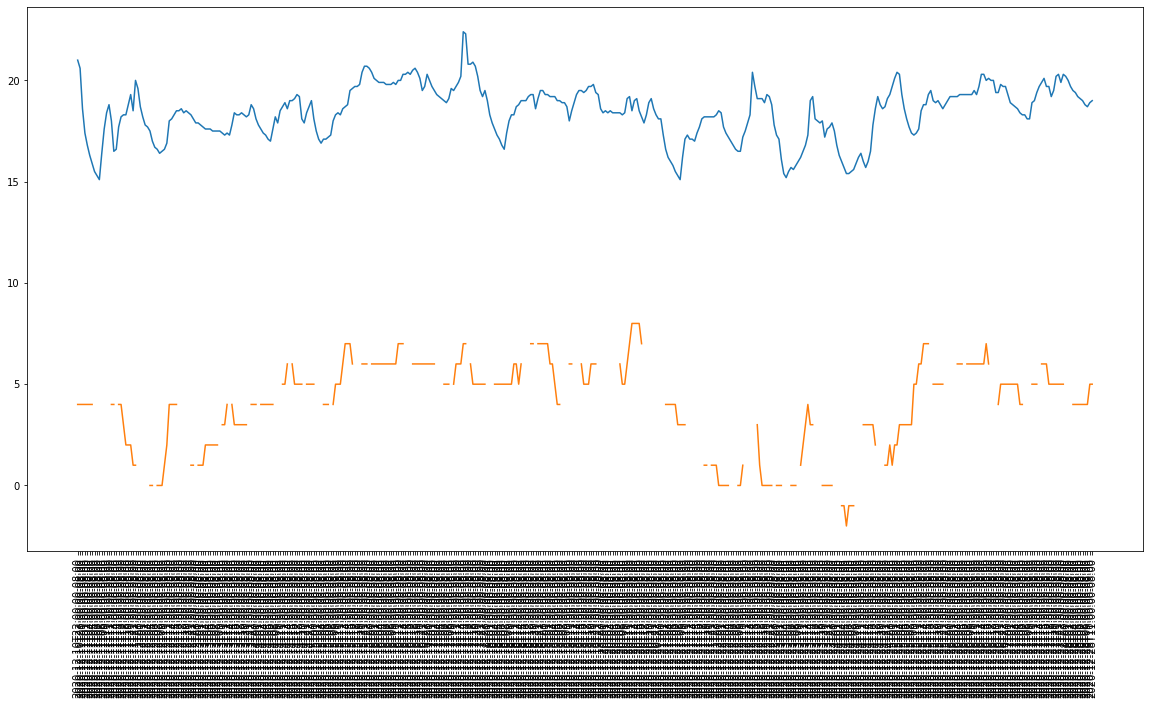
The beauty of being able to grab hourly snapshots is in the fact that I no longer need to rely on IQAir’s pre-calculated aggregate values (e.g. weekly averages) - I have full control over the information that my sensor generates.
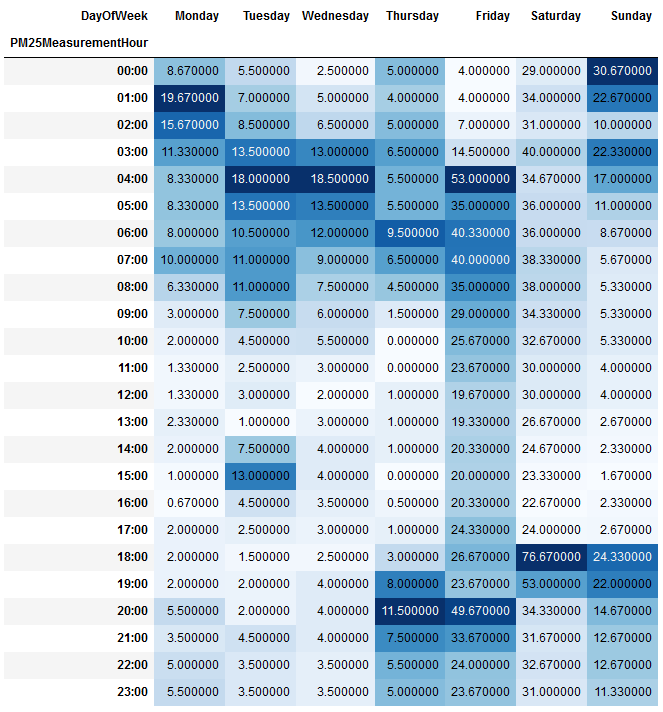
Want to calculate the average AQI over every hour and every day of the week? That’s possible now:
statement = f"""
SELECT printf("%.2f", AVG(IndoorPM25AQI)) PM25Concentration, case cast (strftime('%w', Timestamp) as integer)
  when 0 then 'Sunday'
  when 1 then 'Monday'
  when 2 then 'Tuesday'
  when 3 then 'Wednesday'
  when 4 then 'Thursday'
  when 5 then 'Friday'
  else 'Saturday' end as DayOfWeek, strftime('%H:00', Timestamp) PM25MeasurementHour FROM (
	SELECT Timestamp, IndoorPM25AQI FROM AirQualityData
	GROUP BY 1
	ORDER BY Timestamp DESC)
GROUP BY DayOfWeek, PM25MeasurementHour
"""

df = pd.read_sql_query(statement, data_connection)
df['PM25Concentration'] = pd.to_numeric(df.PM25Concentration)

pivoted_df = df.pivot(index='PM25MeasurementHour', columns='DayOfWeek', values='PM25Concentration')
pivoted_df = pivoted_df.reindex(columns=['Monday', 'Tuesday', 'Wednesday', 'Thursday', 'Friday', 'Saturday', 'Sunday'])
pivoted_df = pivoted_df.replace(np.nan,0)
pivoted_df.style.background_gradient(cmap='Blues')
CO2 concentration averages in the same heatmap format? Yup - can do!
statement = f"""
SELECT printf("%.2f", AVG(IndoorCO2Concentration)) AvgCO2Concentration, case cast (strftime('%w', Timestamp) as integer)
  when 0 then 'Sunday'
  when 1 then 'Monday'
  when 2 then 'Tuesday'
  when 3 then 'Wednesday'
  when 4 then 'Thursday'
  when 5 then 'Friday'
  else 'Saturday' end as DayOfWeek, strftime('%H:00', Timestamp) CO2MeasurementHour FROM (
	SELECT Timestamp, IndoorCO2Concentration FROM AirQualityData
	GROUP BY 1
	ORDER BY Timestamp DESC)
GROUP BY DayOfWeek, CO2MeasurementHour
"""

df = pd.read_sql_query(statement, data_connection)
df['AvgCO2Concentration'] = pd.to_numeric(df.AvgCO2Concentration)

pivoted_df = df.pivot(index='CO2MeasurementHour', columns='DayOfWeek', values='AvgCO2Concentration')
pivoted_df = pivoted_df.reindex(columns=['Monday', 'Tuesday', 'Wednesday', 'Thursday', 'Friday', 'Saturday', 'Sunday'])
pivoted_df = pivoted_df.replace(np.nan,0)
pivoted_df.style.background_gradient(cmap='YlOrRd')
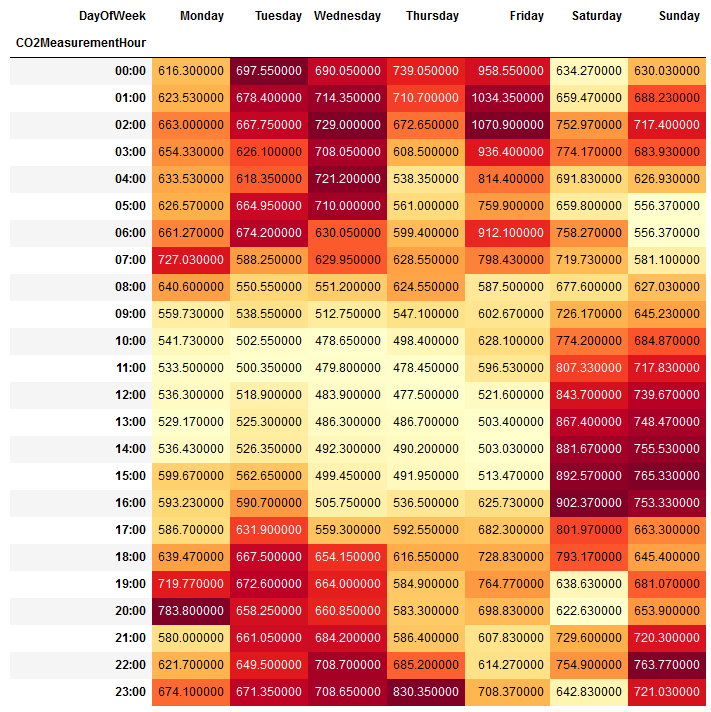
Possibilities are truly endless, because now I manage my own data and a new insight is a SQL query away.
Discovering the web APIs #
But what if you are less adventurous than I am, and for one reason or another you can’t quite MITM your device? Well, as it turns out, there is a web API that does exactly the same thing that the app API does, but with a different auth format that does not require you to obtain the hardcoded API token.
The endpoint you should use is this:
https://website-api.airvisual.com/v1/users/{user_id}/devices/{device_id}?units.temperature=celsius&units.distance=kilometer&AQI=US&language=en
Query parameters are, of course, modifiable. This request requires only one custom header - x-login-token. To get said token, you can issue a POST request to the following URL:
https://website-api.airvisual.com/v1/auth/signin/by/email
The payload you need to send should be your email and password in JSON form, as such:
{"email":"email@address","password":"YourP@ssw0rdGo35H3r3"}
The response you will get will be another JSON document, of the following form:
{
    "id": "YOUR_ID",
    "email": "email@address",
    "name": "Johny Pineappleseed",
    "loginToken": "YourLoginToken="
}
Cool - so this also answers the question as to what you need to insert in {user_id} in the first API endpoint in this section. But what about {device_id}? Is it the same identifier you would use in the mobile API? Apparently not, because every API comes with its own identifiers, apparently (and not the share code). But that’s quite alright, because we can get the right device ID by executing yet another API call, this time to this endpoint:
https://website-api.airvisual.com/v1/users/{user_id}/devices?page=1&perPage=10&sortBy=aqi&sortOrder=desc&filters[]=aqi&filters[]=pm25&filters[]=co2&filters[]=tvoc&filters[]=hcho&filters[]=humidity&filters[]=temperature&units.temperature=celsius&units.distance=kilometer&AQI=US&language=en
Query parameters are optional, but you will need to append the same x-login-token header to this request as well. In return for your effort, you will get a list of devices:
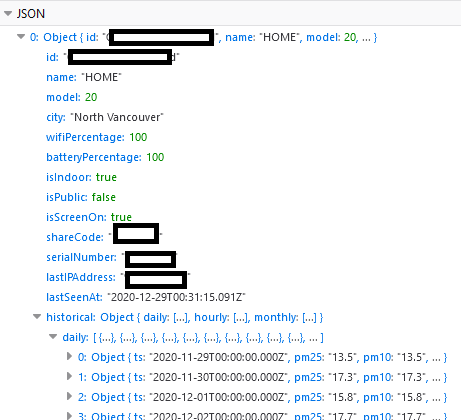
The id field is what I need here, and once I grab this value, I can now execute the very first call I wrote about in this section. But, as you might’ve already noticed, some of the measurement information is returned in the /devices call as well, so you can pick and choose whichever API call suits your needs best.
Conclusion #
This was a fun project to put together not the least because I am a big fan of discovering undocumented APIs that allow me to get more insights about the tools that I use. For my personal use, I’ve wrapped this entire post in a CLI, that I hope to share more about in the future - it makes data storage and inspection significantly easier in a non-interactive session (e.g. running inside a GitHub action). If you have an IQAir device, I hope that this little adventure pointed you in the direction where you can take control of your own data and try to get a better understanding of the air in your dwelling over time.
-
I still remember figuring out how to query the Xbox Live Marketplace. Surprisingly, those APIs still work, ten years later. ↩︎
-
You can read more about it on the vendor page. According to South Coast Air Quality Management District, the sensor is fairly reliable. ↩︎
-
https://den.dev/blog/intercepting-iphone-traffic-mac-for-free/ ↩︎
-
It’s good that I already put one together. ↩︎