GitHub Issues Graph with Netlify and GraphQL
Table of Contents
The other day, Clint Rutkas (yes, that Clint Rutkas) tweeted about a potential scenario that GitHub does not have built-in, but that could be useful for folks that want to have a deeper look at the performance of their repositories - identifying “center of gravity” issues. What that means is essentially finding issues that are cross-referenced the most from other issues.
This functionality is exposed on GitHub through neat, colored references within an issue:
When I saw that tweet, the first thing that came to mind was “Surely, this can be solved with GraphQL.” For the uninitiated (and it’s totally OK if you are), GraphQL stands for “Graph Query Language” and it gives developers the superpower of querying API data as if you are querying it from a database. Instead of crafting a REST API request to some variable endpoint to get the list of issues, then augment that with data from another REST request, you can just package it all up in a single blob of text that tells a service: “Give me this information, with these fields from these other entities.” Minimal headache after learning the basics.
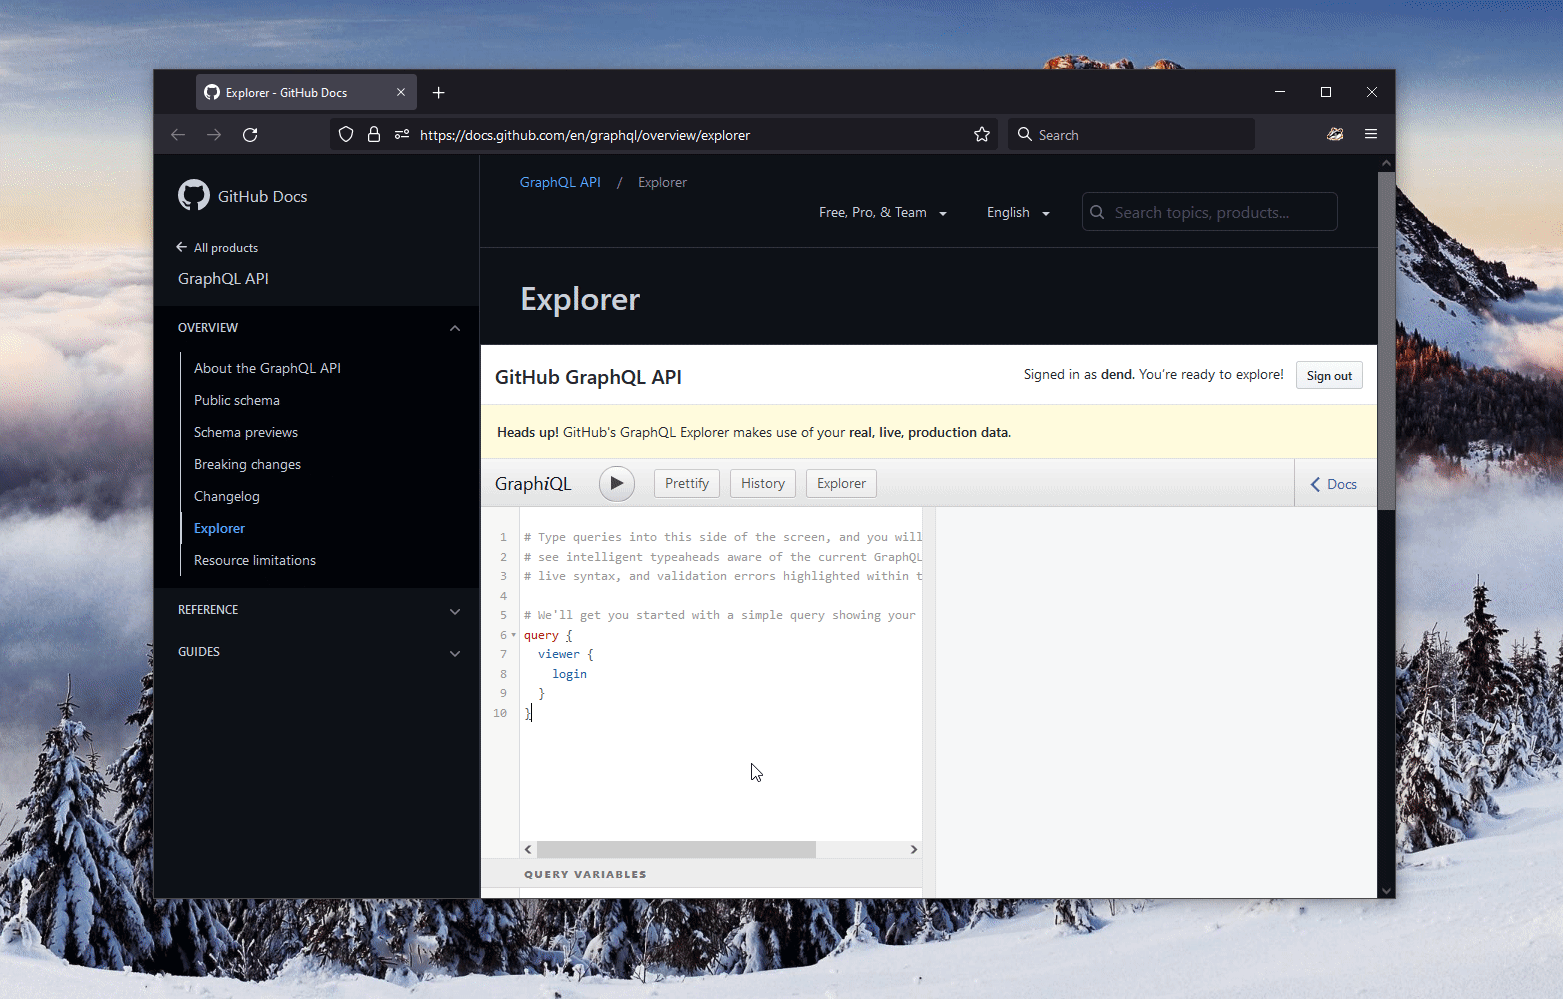
What’s also bonkers to me is just how good the GitHub GraphQL support is. Their entire service surface is exposed through this API, which makes my job in implementing the scenario above very easy. I started the GitHub GraphQL Explorer and created a rudimentary query (scoped to the Microsoft PowerToys repository, as that’s what Clint was looking for) that, in theory, could return me the data I am looking for:
{
  repository(owner: "microsoft", name: "powertoys") {
    issues(first: 100, states: OPEN) {
      totalCount
      pageInfo {
        startCursor
        hasNextPage
        endCursor
      }
      edges {
        node {
          number
          timelineItems(first: 200, itemTypes: CROSS_REFERENCED_EVENT) {
            totalCount
            pageInfo {
              startCursor
              hasNextPage
              endCursor
            }
            nodes {
              ... on CrossReferencedEvent {
                source {
                  ... on Issue {
                    number
                  }
                }
              }
            }
          }
        }
      }
    }
  }
}
The data was, indeed, returned:
Before I go further, let’s step back and learn more about what the query actually does, since it might look like a foreign language to some.
First, I ask GitHub to constrain the results to one repository (Microsoft/PowerToys), which is defined by this line:
repository(owner: "microsoft", name: "powertoys")
What this also means is that nested constraints within this query will be executed within the context of a Repository object, that has its own nested entities and properties.
Next, I want to get the list of open issues:
issues(first: 100, states: OPEN)
This binds my query to an IssueConnection object, that allows me to access all issues within a repository. Here’s the thing, though - I don’t want all issues, I just want to see the ones that are open. Hence, I limit my query to the first one hundred issues (there are pagination constrains, so that I don’t overwhelm the server) that are in the OPEN state.
So far so good. For my own curiosity, I want to know how many issues I have to deal with, so I include the totalCount property next. Because I know that I won’t get all the issues at once (there are more than two thousand, and GitHub is somewhat conservative with volume of results returned at once), I also included a PageInfo structure:
pageInfo {
  startCursor
  hasNextPage
  endCursor
}
This gives me the ability to track whether there are more pages of results that I need to get, as well as how to get to them (through startCursor and endCursor).
With the basic information set, I can now ask GitHub to give me all the edges (read: array of records) that represent issues in the repository that fit the constraints above:
edges {
  node {
    number
    timelineItems(first: 200, itemTypes: CROSS_REFERENCED_EVENT) {
      totalCount
      pageInfo {
        startCursor
        hasNextPage
        endCursor
      }
      nodes {
        ... on CrossReferencedEvent {
          source {
            ... on Issue {
              number
            }
          }
        }
      }
    }
  }
}
For each node (read: issue), I am getting the issue number (its ID) as well as a list of timeline items within said issue. Timeline items can represent a multitude of events, and I only care about tracking one - the cross-reference, where someone references the issue I am tracking from somewhere else.
Similar to how we’ve seen earlier, I am including PageInfo to track if there are more timeline items than a single query can return at once.
Lastly, for all cross-reference nodes (read: data records), I know they’re of type CrossReferencedEvent, so I make that assumption explicit, and within it ask that GitHub include the source of the cross-reference, and for cases where that is an issue, drop in the number of said issue:
nodes {
  ... on CrossReferencedEvent {
    source {
      ... on Issue {
        number
      }
    }
  }
}
The output of this query can look something like this:
{
  "data": {
    "repository": {
      "issues": {
        "totalCount": 2133,
        "pageInfo": {
          "startCursor": "Y3Vyc29yOnYyOpHOGkjSHA==",
          "hasNextPage": true,
          "endCursor": "Y3Vyc29yOnYyOpHOHZoWQw=="
        },
        "edges": [
          {
            "node": {
              "number": 4,
              "timelineItems": {
                "totalCount": 27,
                "pageInfo": {
                  "startCursor": "Y3Vyc29yOnYyOpPPAAABapo_WSACqTkzMTgyNTc5MQ==",
                  "hasNextPage": false,
                  "endCursor": "Y3Vyc29yOnYyOpPPAAABfOagI3gCqjExNDU0NzY0NjU="
                },
                "nodes": [
                  {
                    "source": {
                      "number": 39
                    }
                  },
                  {
                    "source": {
                      "number": 5
                    }
                  }
                ]
              }
            }
          }
        ]
      }
    }
  }
}
Neat! I have all the data that I needed. Now, how to visualize it? I could try and write a script that re-formats the JSON content above into something like a CSV or even a cleaner JSON. I also need a component in this script that handles pagination for me and is capable of storing the full list of issues. Why not just make this a web-first experience? That’s what I did with gravity.
gravity is a code sample, first and foremost - it’s by no means production-quality code but it gets the job done for this simple demo. Instead of walking through every bit of code in the project, I will focus on some key points, and then elaborate on what goes on behind the scenes.
- The project is written using Nuxt.js. The framework is based on Vue and offers quite a few convenience layers, including the ability to generate a completely static site from API-driven fragments within the site code.
- The project leverages Netlify API Authentication. I talked about it earlier in a blog post where I tracked GitHub contributions without any client-side code.
- The project leverages the GitHub GraphQL API under the hood. See the query above? It’s at the foundation of how
gravitygets the data. - Visualization is done with D3. That way I did not need to implement graph drawing from an absolute zero.
- No GitHub credentials are exposed client-side. You can stop looking inside the Network Inspector - the GitHub token is only used at build time, and is never pushed to production.
With this out of the way, you can test-drive the experience yourself at https://gravity-issues.netlify.app.
The structure of the app is quite basic - there is an index.vue page, that is responsible for initial data acquisition and binding to two components - the interactive graph, and a table of issues (each in their separate component file).
When the page first loads (remember that this is done at build time only), a request is sent to GitHub’s GraphQL endpoint with the query information to get the list of issues:
async function getIssues(token: string | null, after: string | null) {
  console.log("Trying to get issues...");
  const headers = {
    Authorization: `bearer ${token}`,
  };
  let body = {};
  if (after) {
    body = {
      query: `query {repository(owner:"microsoft",name:"powertoys"){issues(first:100, states:OPEN, after:"${after}"){totalCount pageInfo{startCursor hasNextPage endCursor}edges{node{number title url state timelineItems(first:200,itemTypes:CROSS_REFERENCED_EVENT){totalCount pageInfo{startCursor hasNextPage endCursor}nodes{...on CrossReferencedEvent{source{...on Issue{number state}}}}}}}}}}`,
    };
  } else {
    body = {
      query:
        'query {repository(owner:"microsoft",name:"powertoys"){issues(first:100, states:OPEN){totalCount pageInfo{startCursor hasNextPage endCursor}edges{node{number title url state timelineItems(first:200,itemTypes:CROSS_REFERENCED_EVENT){totalCount pageInfo{startCursor hasNextPage endCursor}nodes{...on CrossReferencedEvent{source{...on Issue{number state}}}}}}}}}}',
    };
  }
  const response = await fetch("https://api.github.com/graphql", {
    method: "POST",
    body: JSON.stringify(body),
    headers: headers,
  });
  const data = await response.json();
  return data;
}
The token here is obtained slightly earlier by querying the secrets from the Netlify vault, that is exposed through the use of the @netlify/functions package.
As I mentioned earlier, the data returned from GraphQL is “dirty” in that its structure is completely unfit for easy processing and rendering. Instead, what I needed was something that D3, the visualization framework, can ingest. I needed to transform the returned JSON into something resembling the snippet below:
{
  "nodes" : [
    { ... }
  ],
  "links": [
    { ... }
  ]
}
Where nodes would contain a list of unique issues and their states (open or closed), and links would contain the issue relationship data (which issue connects to which other issue). To compute the nodes, I crafted a dedicated function:
function computeNodeStates(nodeContainer: Array<Edge[]> | null) {
  let nodeStates: Array<BarebonesNode> = [];
  if (nodeContainer) {
    nodeContainer.forEach(function (nodeBlock) {
      nodeBlock.forEach(function (node) {
        let topLevelNode: BarebonesNode = {
          id: node.node.number.toString(),
          group: equalsIgnoringCase(node.node.state, "OPEN") ? 1 : 0,
        };
        nodeStates.push(topLevelNode);
        node.node.timelineItems.nodes.forEach(function (referenceNode) {
          if (referenceNode.source.number) {
            let nestedNode: BarebonesNode = {
              id: referenceNode.source.number.toString(),
              group: equalsIgnoringCase(referenceNode.source.state, "OPEN")
                ? 1
                : 0,
            };
            nodeStates.push(nestedNode);
          }
        });
      });
    });
  }
  let filteredNodeStates = nodeStates.filter(
    (value, index, array) => array.findIndex((t) => t.id === value.id) === index
  );
  return filteredNodeStates;
}
Because I am using TypeScript, I get the benefit of object types, so all I am doing is traversing the JSON I got from GitHub and then adding every identified issue, both top-level (the one in the first list) and nested (the ones in which the top-level issue is referenced) to an array that is then de-duplicated and returned.
One thing of note above is the group property. Just what is this? Earlier I mentioned that I only wanted to query open issues in the repository, but what I didn’t call out was the fact that issues that are cross-referenced can be closed. Think of the scenario where an issue is closed as a duplicate with a reference to the main issue. Depending on the state, I assign an issue to group 1 (if it’s open) or 0 (if it’s closed). This will be helpful later, once we render the graph.
For the links, the process is somewhat similar when it comes to parsing the GitHub GraphQL API-returned JSON - I also happen to have a function for it:
function computeLinks(nodeContainer: Array<Edge[]> | null) {
  let relationships: any = [];
  if (nodeContainer) {
    nodeContainer.forEach(function (nodeBlock) {
      nodeBlock.forEach(function (node) {
        let number = node.node.number;
        node.node.timelineItems.nodes.forEach(function (referenceNode) {
          if (referenceNode.source.number) {
            let relationship: Relationship = {
              source: number.toString(),
              target: referenceNode.source.number.toString(),
              weight: 6,
            };
            relationships.push(relationship);
          }
        });
      });
    });
    let filteredRelationships = relationships.filter(function (
      entity: Relationship
    ) {
      return entity.source != null && entity.target != null;
    });
    return filteredRelationships;
  } else {
    return { error: "Could not compute links." };
  }
}
Each relationship that is generated is created based on the top-level node ID (the issue number) and any nested nodes (referenced issues). Then, once again - drop all that in an array, remove the ones where there is a chance that the source or the target is null (not that frequent and limited by the checks in the function), and give the array back to whatever function requested it. But which function did request it?
There is one called asyncData that is called when the page is loaded. It nicely wraps the functions above as such:
let relationships = computeLinks(sanitizedIssues);
let nodeStates = computeNodeStates(sanitizedIssues);

let d3data: D3DataContainer = {
  nodes: nodeStates,
  links: relationships,
};
In the example above, D3DataContainer is an interface that matches the earlier requirements I mentioned for the D3 data ingestion:
export interface D3DataContainer {
  nodes: Array<BarebonesNode>;
  links: Array<Relationship>;
}
The hardest part is done! Now to render the data. Based on the JSON blob that I can operate on, I pass it to a createNetwork function that computes the edges and nodes of the graph. That is later passed to D3 to generate a force layout, that uses physics-based simulator for positioning visual elements. That is, elements can have “charge” and can be attracted or repelled from one another. Plus, we get gravity out-of-the-box - what’s not to like!
There is a bit of setup involved to define the styling of the graph along with some of its behaviors, but once done, we get the full graph representation in its glory:
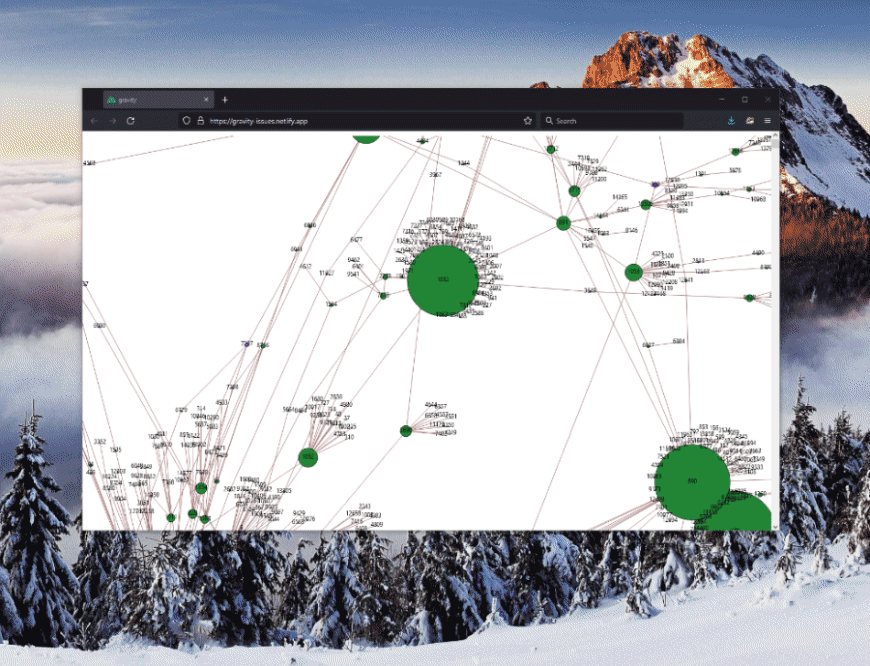
Notice how issues that are closed are colored in GitHub’s standard purple, while those that are open are green. Makes it easy to spot the relationships! Additionally, one can zoom and pan through the graph to see the full picture. Rad!
Conclusion #
This was a fun challenge to explore. I still need to update the README to include instructions on deployment and modifications, so stay tuned for that as well. Hopefully one day I will get to productize this experience better (whenever more open time lands on my calendar).