Sending Your MSAL Telemetry To Azure Application Insights
Table of Contents
Just last week my team released the Microsoft Authentication Library for .NET version 4.58.0. One of the notable changes with this release was the support for OpenTelemetry - an open standard for logging and telemetry aggregation. What’s neat about OpenTelemetry is that a developer can have a multitude of exporters - plug-ins to the OpenTelemetry SDK that allow sending logs to a wide array of locations with minimum overhead (that is - writing plumbing code).
Monitoring your MSAL applications is, generally, a good idea for production-grade applications. You want to know if there are any authentication failures occurring. You also want to know where they are happening, whether they are tied to a supported version of the library, or a specific SKU (e.g., MSAL for .NET Framework) among other things.
In the MSAL.NET documentation we showed how to use the console exporter to log telemetry messages to the Terminal, but that’s not quite suitable for production scenarios - you don’t want to be outputting everything to a console because usually there is no console available. Instead, you could use services like Azure Monitor that allows aggregating the data where your infrastructure lives - in the cloud. As an added bonus, Azure Monitor also provides an exporter for .NET applications. Let’s build a sample application that shows how this will work end-to-end.
Prerequisites #
It’s worth mentioning that while I am using Windows with Visual Studio to build my sample application, you can do this on any platform where .NET is supported. You might need to tweak the code a bit because the authentication component broker I am using is not available on macOS and Linux. You can use our documentation to learn how to do it. So, with that out of the way, you will need:
- .NET SDK installed on your machine.
Microsoft.Identity.Clientadded as a project dependency to your application.Microsoft.Identity.Client.Brokeradded as a project dependency to your application - we will be building a local console app that uses the Web Account Manager (WAM).OpenTelemetryadded as a project dependency to your application.Azure.Monitor.OpenTelemetry.Exporteradded as a project dependency to your application.- An active Azure subscription.
- An active Microsoft Entra ID app registration.
- An active Application Insights instance.
Building the authentication flow #
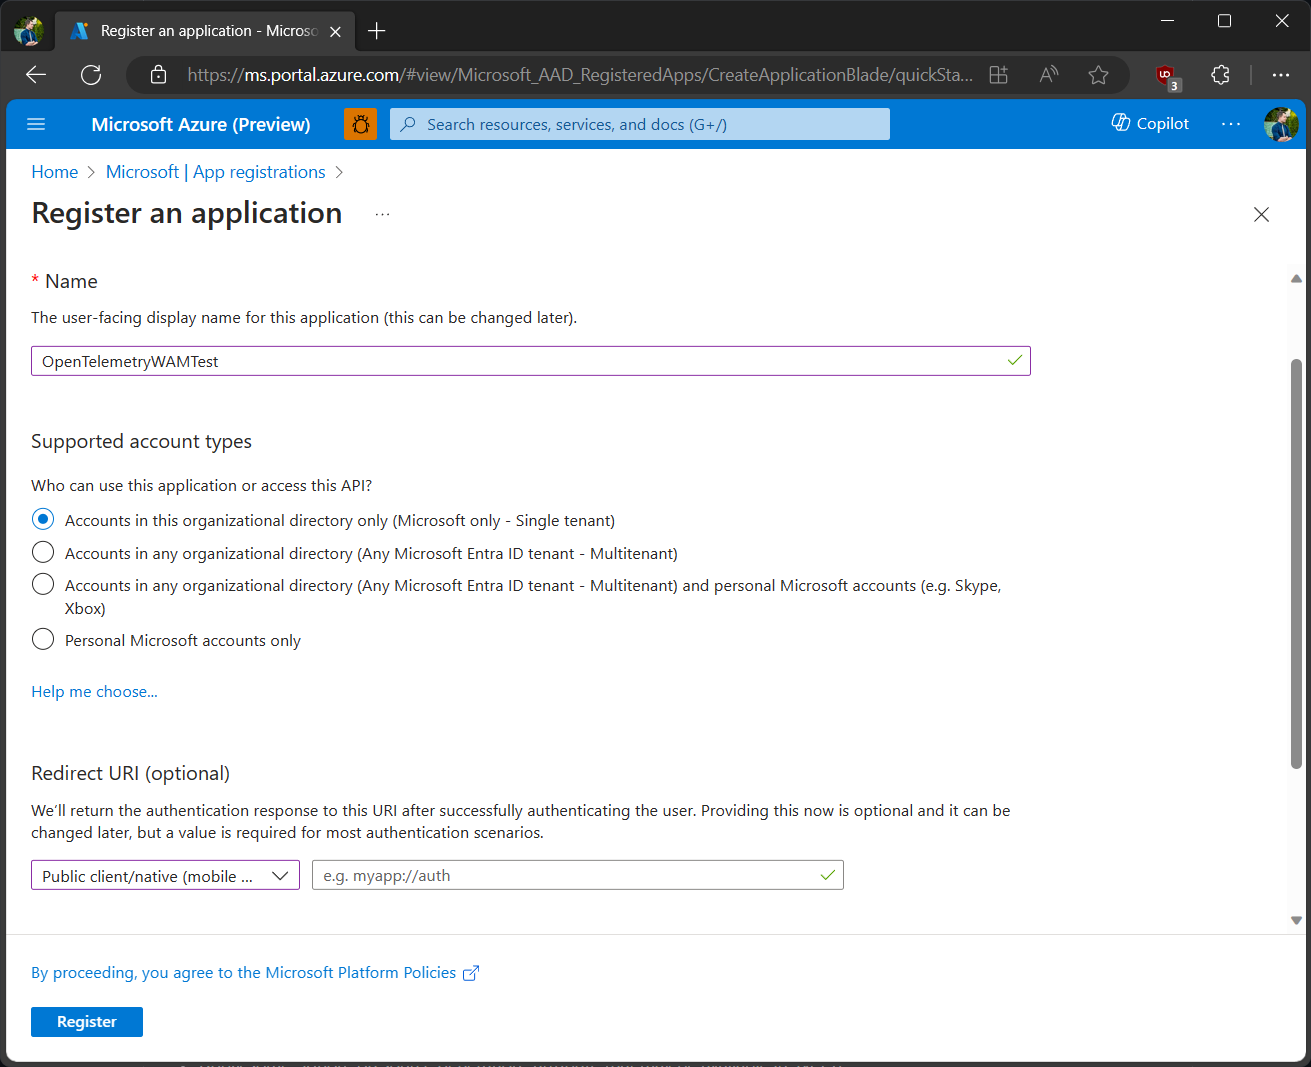
First, make sure that you have an app registered in the Azure portal. For testing purposes, I only allowed my application to sign users in from my tenant.
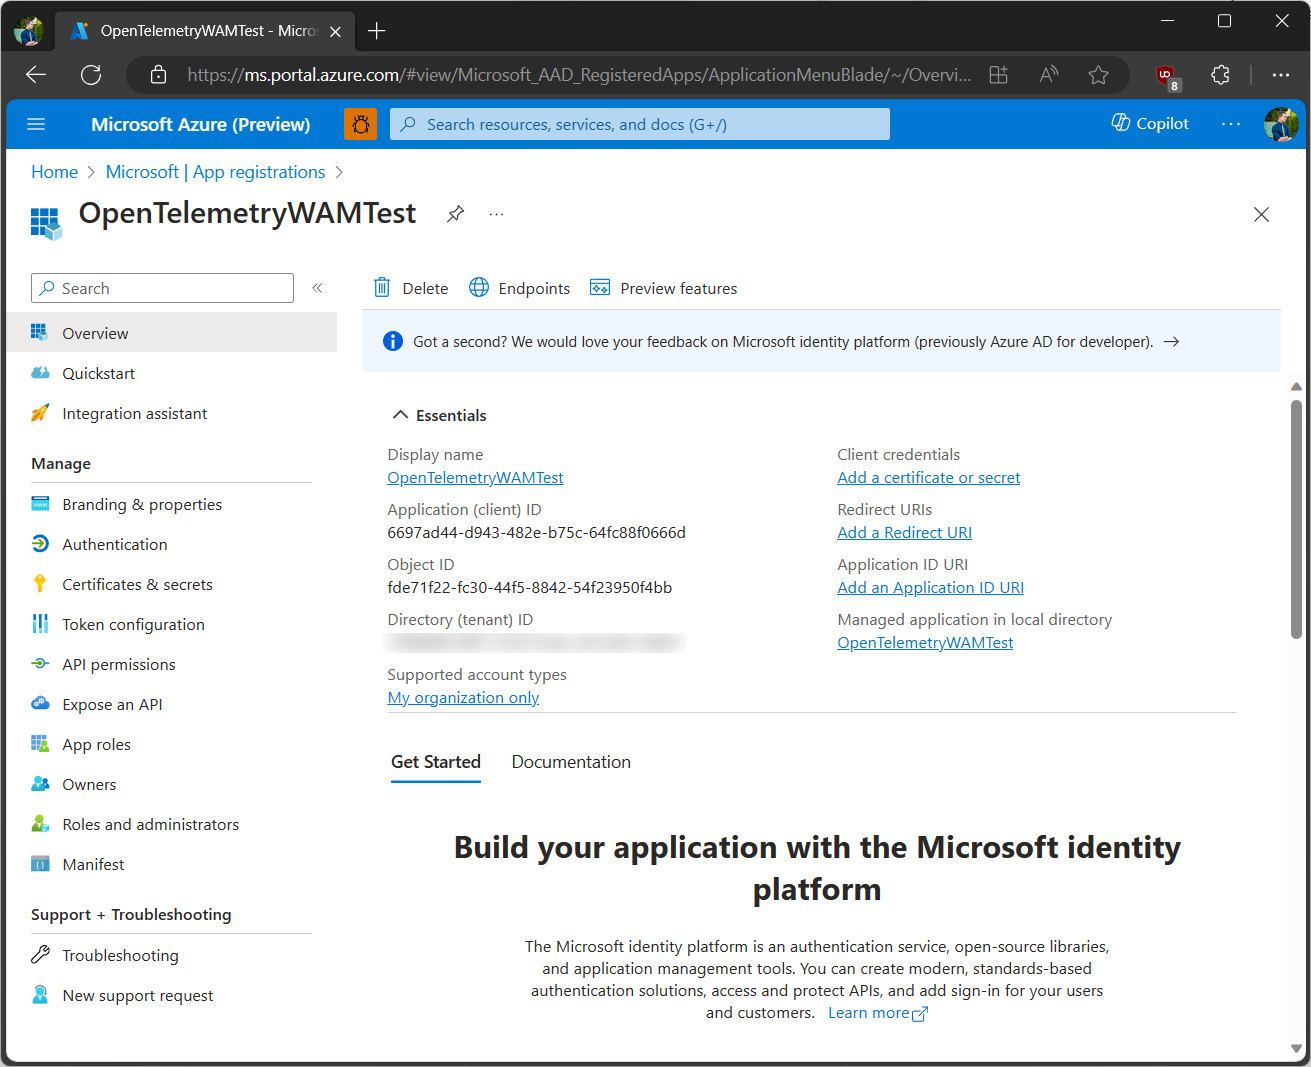
Once the app registration completes, I should now have a client ID ready that I can use in code - this is what will be used to identify the application to the authentication service. You can grab it from the Application (client) ID section in the application properties:
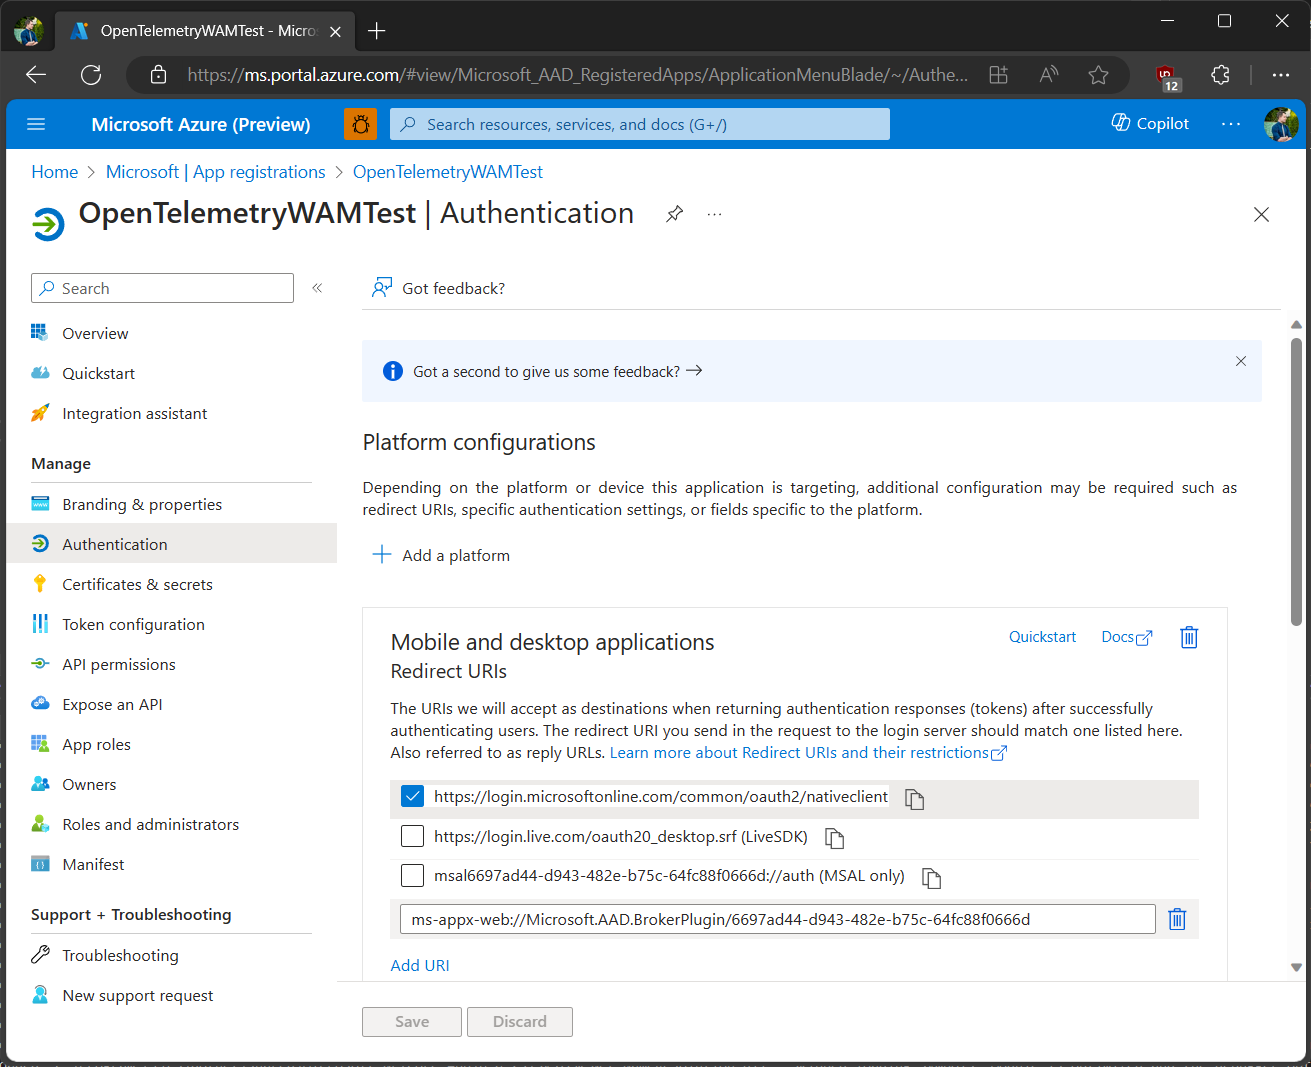
With the application created, make sure to also add the proper redirect URIs for it, allowing us to use WAM:
ms-appx-web://Microsoft.AAD.BrokerPlugin/YOUR_APP_CLIENT_ID
If you don't specify a broker-specific redirect URI and attempt to use the WAM component on Windows for authentication, during token acquisition MSAL will throw an exception.
We can now jump into code. To start, add the necessary using statements that will allow us to take advantage of MSAL, OpenTelemetry, and exporter capabilities:
using Microsoft.Identity.Client;
using Microsoft.Identity.Client.Broker;
using OpenTelemetry;
using OpenTelemetry.Metrics;
using Azure.Monitor.OpenTelemetry.Exporter;
Now, in your application we need to instantiate a new meter provider, with the help of CreateMeterProviderBuilder:
 using var meterProvider = Sdk.CreateMeterProviderBuilder()
    .AddMeter("MicrosoftIdentityClient_Common_Meter")
    .AddAzureMonitorMetricExporter(options =>
    {
        options.ConnectionString = "APP_INSIGHTS_CONNECTION_STRING";
    })
    .Build();
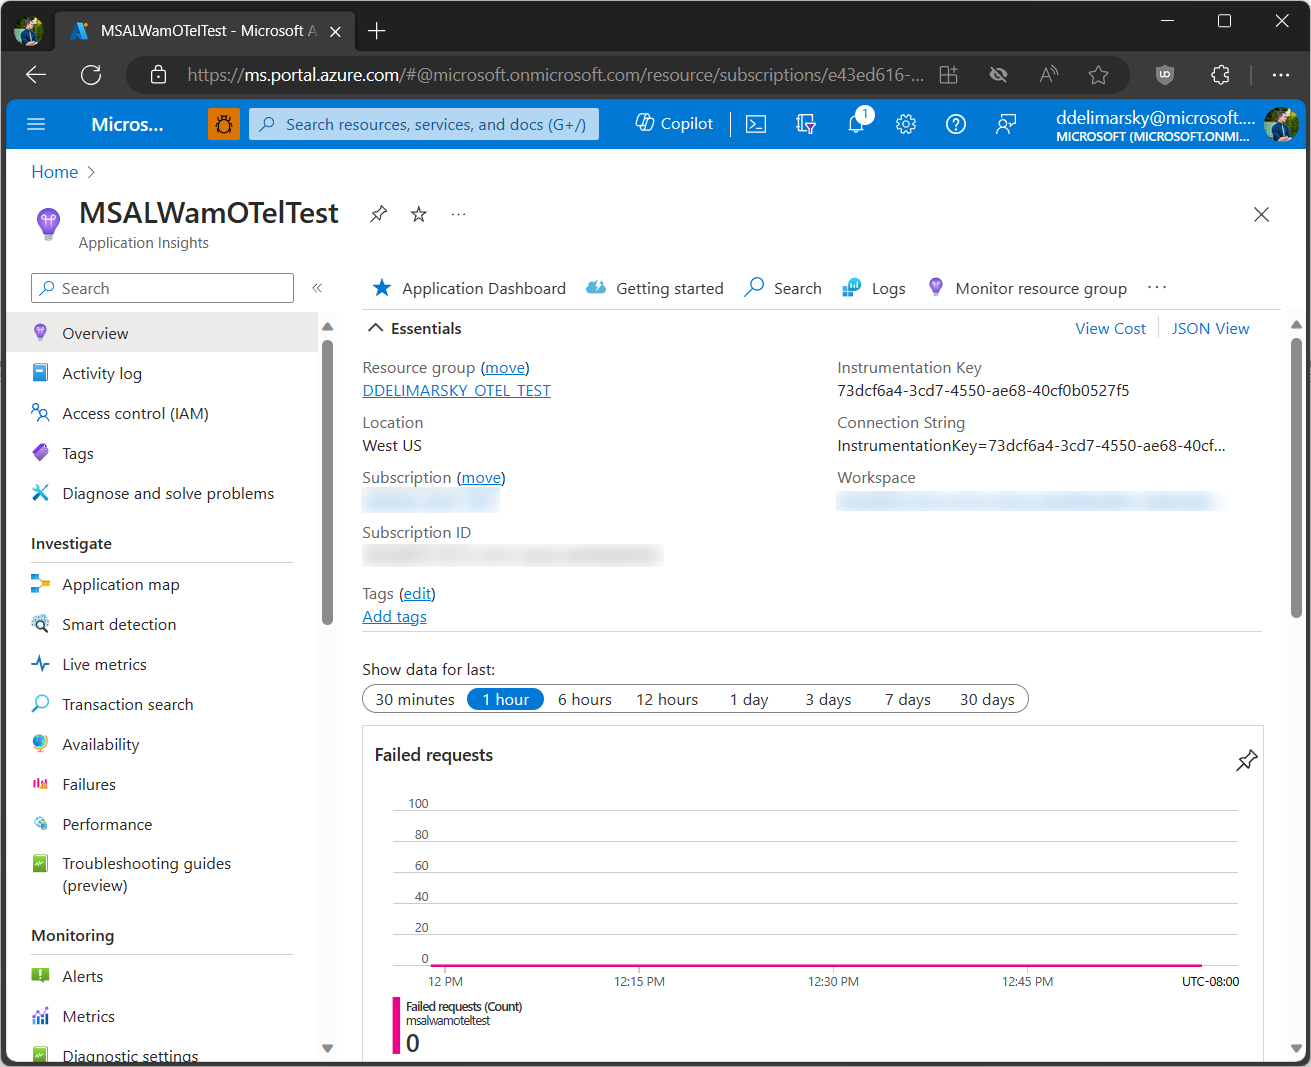
The APP_INSIGHTS_CONNECTION_STRING value can be obtained from the Azure Portal when you navigate to the Application Insights instance properties.
We’re using the MicrosoftIdentityClient_Common_Meter meter that is embedded in MSAL (you should not change that name), followed by also adding the Azure Monitor exporter with the help of AddAzureMonitorMetricExporter.
Now, we can implement the authentication flow with the Windows broker - notice that I am specifying my application ID during IPublicClientApplication instantiation:
 var scopes = new[] { "User.Read" };

BrokerOptions options = new(BrokerOptions.OperatingSystems.Windows)
{
    Title = "My Awesome Application"
};

IPublicClientApplication app =
    PublicClientApplicationBuilder.Create("6697ad44-d943-482e-b75c-64fc88f0666d")
    .WithAuthority("https://login.microsoftonline.com/organizations")
    .WithDefaultRedirectUri()
    .WithParentActivityOrWindow(GetConsoleOrTerminalWindow)
    .WithBroker(options)
    .Build();

AuthenticationResult result = await app
  .AcquireTokenInteractive(scopes)
  .ExecuteAsync();
In the snippet above, GetConsoleOrTerminalWindow is a reference to the function that acquires the currently active console window:
[DllImport("user32.dll", ExactSpelling = true)]
static extern IntPtr GetAncestor(IntPtr hwnd, GetAncestorFlags flags);

[DllImport("kernel32.dll")]
static extern IntPtr GetConsoleWindow();

public IntPtr GetConsoleOrTerminalWindow()
{
    IntPtr consoleHandle = GetConsoleWindow();
    IntPtr handle = GetAncestor(consoleHandle, GetAncestorFlags.GetRootOwner );

    return handle;
}
Let’s run the application now. If the code is set up properly, you should get the option to pick an account to sign in with (or, if you have no accounts linked - enter one):
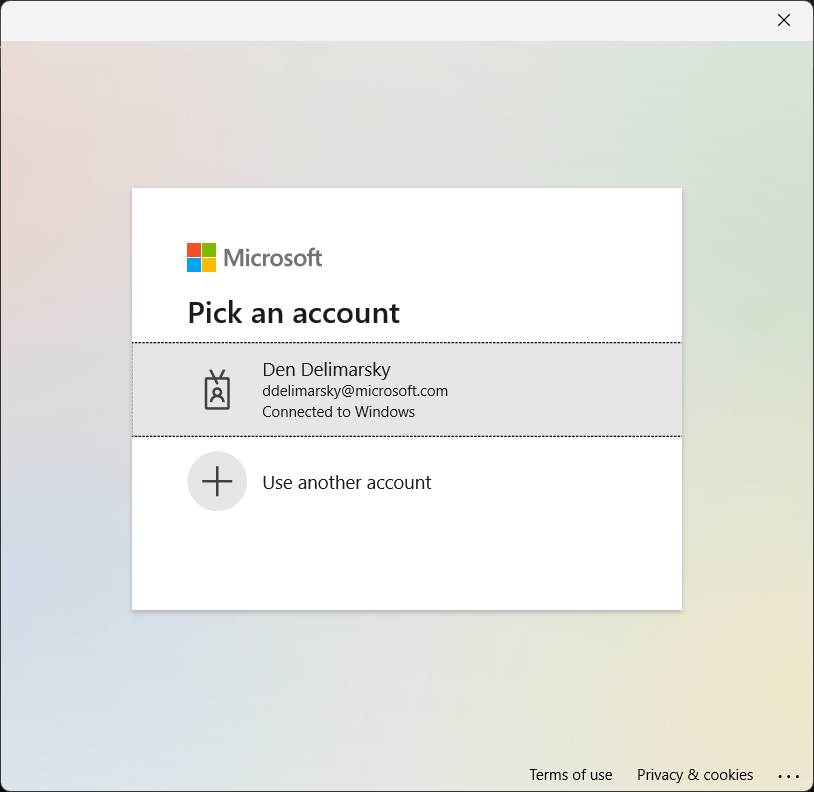
And if it’s the first time you’re signing in with this application ID, you will also see a consent prompt:
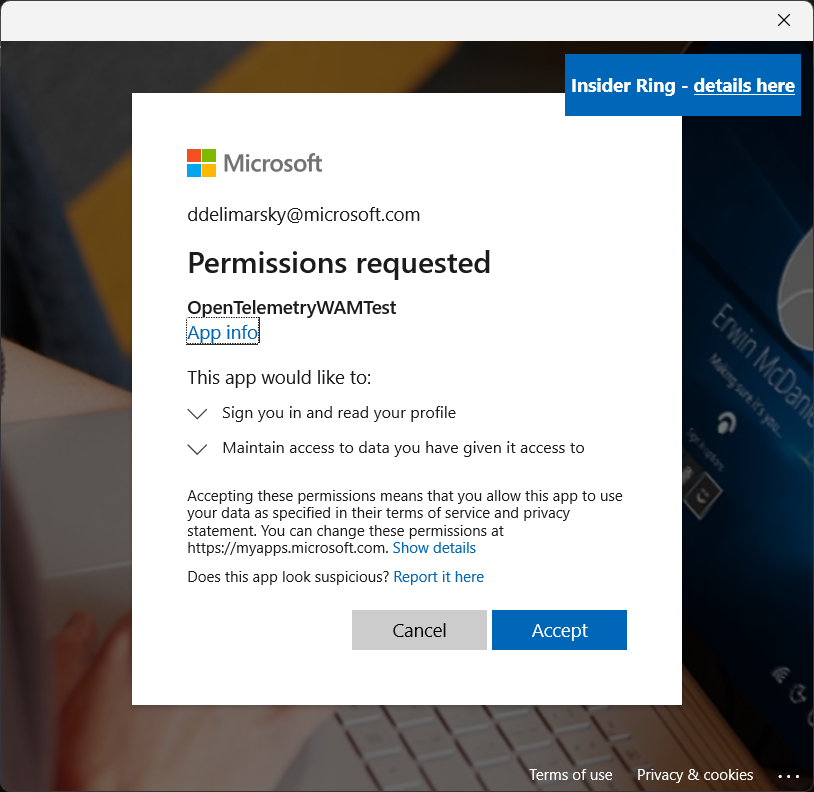
And once you consent - that’s it. You now have a token. That is, of course, if you configured the application correctly with the WAM redirect URL mentioned above. But also you might’ve noticed that nothing else happened. There was no output in the terminal, there was no other message presented. What happened to the telemetry that we were sending?
Checking for the telemetry #
To check what our telemetry is flowing, let’s get back to the Azure Portal and go to the Logs section where we can run Kusto queries on the collected data.
You can write a test query like this, extracting the last 10 records from the customMetrics table:
customMetrics
| take 10
If metrics are flowing, you should be able to see the results show up in the table below the query:
Give a few minutes between running the application and executing the query in the Application Insights blade. There is a delay between data ingestion and availability through the queryable table.
Congratulations - you’re now able to monitor the performance of your MSAL applications without dealing with manual log collection on the local machine.
Customizing the outbound telemetry flow #
The scenario I outlined above is fairly rudimentary - we created a new MSAL.NET application, we connected it to Application Insights, and then tested the authentication flow to make sure that the metrics are properly captured. In production scenarios, additional factors start coming in - you likely want to authenticate the telemetry sender to prevent junk metrics being injected by malicious actors, or maybe you want to ensure that there is a local copy of the logs in case there is a network outage. To learn more about these scenarios, refer to the official Azure Monitor documentation.