Get GitHub User Contributions With GitHub Skyline API
2021 turns out to be a good year for folks like myself, that love collecting their own personal metrics. Earlier, I chatted about collecting air quality data, Twitter data - and now, GitHub contribution data. In this post I will describe a simple approach to grabbing your own GitHub contribution statistics without having to jump through too many hoops.
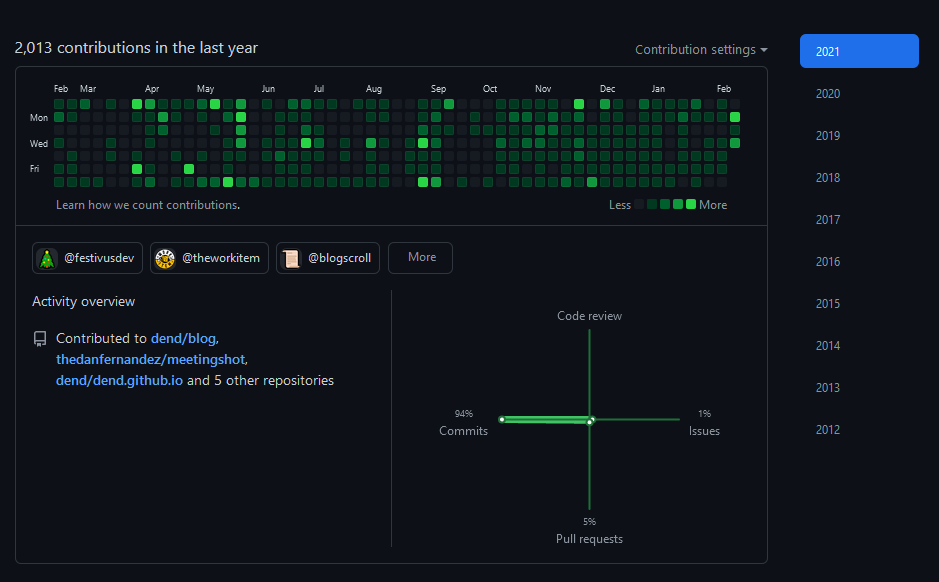
GitHub has a fancy visualization tool, called Skyline, that allows the generation of a 3D model based on a user’s GitHub contribution graph. You know, those green squares on your GitHub profile?
Skyline makes them look like this:

Fancy! But seeing this, I asked myself - is there an API that allows me to get the contributions the same way this tool is using? There sure are many third-party packages out there that can do that, but that means taking a dependency on code I don’t know (not that in this case it’s that critical).
The answer was in the network inspector all along! The API is as simple as this:
https://skyline.github.com/dend/2020.json
A request to this endpoint produces a nicely-formatted JSON that gives a very detailed breakdown of my activity (aggregated, of course):
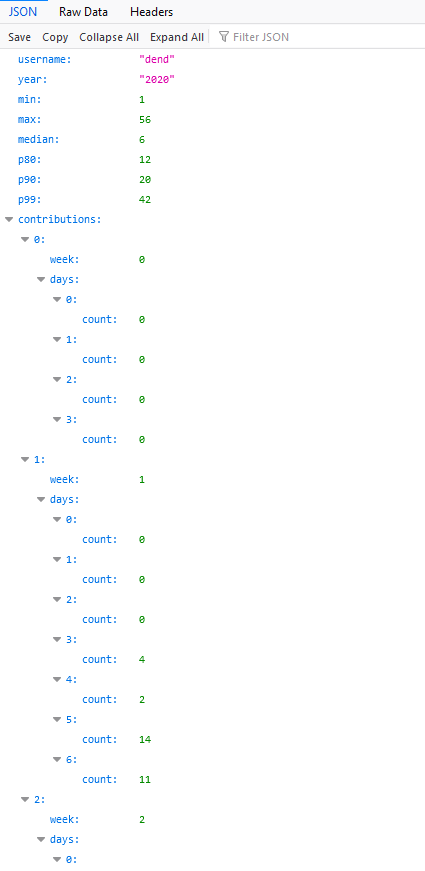
More than that, the API gives such pre-calculated stats as the median contribution volume per year, max contribution count, p80, p90, and p99 percentile values. Neat! And we’re getting all this without having to authenticate or deal with GraphQL. With this data, I can now slice and dice my own numbers and visualize them in whichever way I want.
And before you ask, yes, this API does return values for any year that a user has been active on GitHub. For me, it went all the way back to 2012.