Building Your Own Twitter Analytics
Table of Contents
TL;DR: Check the source code out on GitHub for the project. It’s a demonstration of how you can use simple components to build awesome tools. That’s right, you don’t need Kubernetes for this!
Table of contents #
Introduction #
I’m one of those people that needs data around the things that I do - there is just something fun about being able to quantify and analyze things. One day, I was just sipping on my coffee when I realized that the analytics that Twitter gives me by default are just not good enough for me - I wanted to be able to pivot the data in whichever way I wanted. If I post my tweets at certain times of the day, does one specific hour provide more visibility than the other one? Are longer or shorter tweets the ones that result in more engagement? And most importantly - can I compare the performance of my tweets with those of other prominent Twitter users?
This only meant one thing - I needed to build a tool that picks up Twitter data, stores it for analysis and then provides some insights. Now, I should mention that I am using this entirely for non-commercial and purely educational purposes - if you plan on building something like this for broader usage, you likely will need some special Twitter permissions. For me, I just used the standard API (you can sign up for access). There are also other approaches - for example, rely on tools such as twint to get the same results. The choice is, ultimately, yours.
The basics #
Because I am just experimenting, the key was simplicity. I don’t need some complex microservice architecture here - I need a tool that does the ingress, a data store and a rendering layer where I can dig into the numbers. Working with data, Python was my go-to choice - if you are going to be following the article below and plan to run the code I am talking about, right now might be a good time to check whether python --version runs in your terminal without any errors.
Let’s do a quick overview of each piece.
Ingress #
For the tool that does the ingress, I can just write a Python script. What this script needs to do is talk to the Twitter API on a regular and grab the results for some key markers:
- User snapshots. At the time of the data capture, get basic user parameters, such as the number of followers, number of people the user is following, number of likes and so on. This allows you to track the audience over time.
- Tweet snapshots. Not only is it interesting to see the progression of one’s audience growth (or stagnation), but also the impact and growth one’s tweets have. To track that, the ingress script should capture available tweets through each run.
With the above, it should be relatively trivial to do any kind of further analysis. One thing that I did not focus much in this project is the network graph - the connections people form, which could be an insightful area to look into if you’re studying the virality of certain content by looking at who picks it up across which network edges. But that’s for another post.
Data store #
For the data store, I chose SQLite. As the developers state on the official site1:
SQLite does not compete with client/server databases. SQLite competes with fopen().
Just what I needed! After all, I am not trying to build a geo-distributed highly scalable service at this time, I am just looking at improving my own Twitter analysis capabilities. The simpler - the better. SQLite is just lightweight enough to give me the flexibility and portability I need and is capable enough so that I can run SQL queries on the data.
Rendering layer #
Two words - Jupyter Notebook. I could build a fancier project with Flask and D3.js (you can check out what that would look like in the project repo2 when you have some free time), or I could just use a local notebook where I can plug a colorful array of Python libraries that can show me the data the way I want it. The latter just sounded more appealing and easier to experiment with without losing focus on what’s important - the data.
Building the tools #
Let’s get to the hammers and wrenches and start building the tools necessary to analyze your own Twitter data.
SQLite database #
The database in my case is fairly simple - I have four tables that capture everything I need to have, that have a relatively straightforward schema, captured in the screenshot below:
You can create more entities if you need to keep track of things like the user graph, but the tables above capture the bulk of the information that is necessary for analysis.
Ingress script #
The ingress script ended up being surprisingly “simple”. All I wanted to do is for it to take a couple of parameters from the command line and then based on those start grabbing the data and pushing it into a local SQLite database. The __main__.py3 looks like this:
import argparse
from sys import argv
from ingress import command_processor
import configparser
import sqlite3

PARSER = argparse.ArgumentParser(description='Twitter Data Ingress - version 0.1')
SUB_PARSERS = PARSER.add_subparsers(dest="commands_parser")
MAKE_PARSER = SUB_PARSERS.add_parser('start')

MAKE_PARSER.add_argument('--account', metavar='L', type=str,
                         help='Account identifier for a given service.')
MAKE_PARSER.add_argument('--service', metavar='S', type=str,
                         help='The service for which the data is being collected.')

ARGS = PARSER.parse_args()

config = configparser.ConfigParser()
config.read('service.cfg')

if config is not None:
    if len(argv) <= 1:
        print('[error] No command line arguments supplied to the CLI. Terminating.')
    else:
        if ARGS.commands_parser == 'start':
            if ARGS.account is not None and ARGS.service is not None:
                print(f'[info] Starting ingress process for {ARGS.service} (user ID: {ARGS.account})')

                # Connects to the local SQLite database to store captured tweets.
                data_connection = sqlite3.connect(config['Datastore']['Database'])

                command_processor.start_ingress(ARGS.service, ARGS.account, config, data_connection)
            else:
                print('[error] Could not start ingress process. Ensure that the parameters are correct.')
else:
    print('[error] Could not read the configuration file. Make sure that service.cfg is properly set up.')
So what’s going on here? First, the script is reading the command line parameters - --account and --service. --account is the Twitter handle for the user for which the data should be collected, and --service is the service from which the data should be obtained. The reason the second parameter is there is because I wanted to use the tool for other services, but so far implemented just Twitter. Feel free to skip it altogether for now if you don’t want to deal with it.
Next, the script reads in a configuration file, that I use to store the Twitter API key and the data store information. It’s a regular INI file with a .cfg extension, that looks like this:
[Twitter]
ConsumerKey = ABCDE12345678910
ConsumerSecret = ABCDE12345678910
AccessToken = ABCDE12345678910
AccessTokenSecret = ABCDE12345678910

[Datastore]
Database = data/datafile.db
I keep everything in a config file because it makes it that much easier to manage the instances of specific keys or references to persistent files. If you are going down this path, make sure that the config file is excluded from your Git history through .gitignore. Alternatively, you could implement Git hooks that strip the credentials from the file before the checkin. You don’t want to end up in a situation where you have to revoke and regenerate keys because some malicious actor decided to look inside your repository4.
Lastly, the script checks whether the right arguments were specified, and if they were - triggers the ingress process by first initializing a connection to the data store, with the help of sqlite3.connect, and then proceeding to call start_ingress.
In command_processor.py, the start_ingress function is responsible for getting Twitter data for the user and then storing it in SQLite, in the data store that is defined in the configuration file. It looks like this:
def start_ingress(service, account, config, data_connection):
    if service.lower() == 'twitter':
        twitter_api = get_twitter_instance(config)

        while True:
            try:
                user = twitter_api.GetUser(screen_name=account)

                if not user_exists(user, data_connection):
                    capture_user(user, data_connection)

                take_user_snapshot(user, data_connection)

                update_user_tweets(user.screen_name, config, data_connection)
            except twitter.error.TwitterError as rate_error:
                print(f"[error] Hit a rate limit error. {rate_error.message}. Sleeping started at {datetime.now()}...")
                time.sleep(900)
            break
This function relies on the python-twitter library to get access to the necessary information. As you can see in the snippet above, I am first initializing the Twitter API client. It’s wrapped in get_twitter_instance for easier management:
def get_twitter_instance(config):
    return twitter.Api(consumer_key=config['Twitter']['ConsumerKey'],
                                  consumer_secret=config['Twitter']['ConsumerSecret'],
                                  access_token_key=config['Twitter']['AccessToken'],
                                  access_token_secret=config['Twitter']['AccessTokenSecret'],
                                  tweet_mode='extended',
                                  sleep_on_rate_limit=True)
The information for the client is taken from the configuration file that I described earlier.
After that, I am triggering a loop that goes through obtaining user information first and then checking if the user already exists in our data store (it could be that it’s a new user), takes a snapshot of the current basic user information through take_user_snapshot and then triggers an update to the user’s tweet collection that we have stored in our database with update_user_tweets.
You might be asking - “Den, but why do you need a loop to do a one-time capture?” You see, the problem is that the Twitter API has limits in certain cases, that reset every 15 minutes. If the script hits one of those limits, it will fail and crash. To prevent that, I am running the data collector in a loop until it collects all the data with no exceptions and reaches break.
In the snippet above, user_exists just runs a SQL query on the data store to see if there is already a record present:
def user_exists(user, data_connection):
    cursor = data_connection.cursor()
    statement = "SELECT * FROM users WHERE id COLLATE NOCASE = ? LIMIT 1"
    cursor.execute(statement, (user.id_str,))
    return cursor.fetchone() is not None
capture_user, in its turn, runs another SQL query that inserts the data that was made available in the user object:
def capture_user(user, data_connection):
    cursor = data_connection.cursor()

    print(f'[info] User {user.id_str} does not exist in the database. Adding...')

    current_time = get_current_time_to_schema_date()
    converted_date = get_twitter_date_to_schema_date(user.created_at)

    cursor.execute(f'INSERT INTO users (id, name, bio, time_of_registration, time_of_capture, location, screen_name) VALUES ("{user.id_str}", "{user.name}", "{user.description}", "{converted_date}", "{current_time}", "{user.location}", "{user.screen_name}")')
    data_connection.commit()
    print(f'[info] User {user.id_str} added.')
It’s important that the date and time format that I am using for storage is following the ISO-8601 standard, so that I can run time and date-based operations in SQLite. That’s why I hacked together two helper functions, that you see called before insertion: get_current_time_to_schema_date and get_twitter_date_to_schema_date.
def get_twitter_date_to_schema_date(twitter_date):
    converted_date_raw = datetime.strptime(twitter_date, "%a %b %d %H:%M:%S %z %Y")

    return converted_date_raw.isoformat()

def get_current_time_to_schema_date():
    current_time = datetime.now()

    return current_time.isoformat()
The last important function from start_ingress is update_user_tweets - it actually grabs the timeline and sequences it into individual tweets that are then saved in the database. The function looks like this:
def update_user_tweets(user, config, data_connection):
    print(f'[info] Preparing to aggregate tweets for user {user}...')
    twitter_api = get_twitter_instance(config)

    while True:
        try:
            timeline = twitter_api.GetUserTimeline(screen_name=user, count=200)

            for tweet in timeline:
                log_tweet(tweet, config, data_connection)

            print(f'[info] Timeline for {user} captured.')
        except twitter.error.TwitterError as rate_error:
            print(f"[error] Hit a rate limit error. {rate_error.message}. Sleeping started at {datetime.now()}...")
            time.sleep(900)
        break
Not that different from the user-capturing function (capture_user) - Twitter API is used to get the user timeline to the maximum of 200 tweets allowed at once5. But then there is another function - log_tweet, called for each tweet identified in the timeline. What does it do? It’s presented in the snippet below:
def log_tweet(tweet, config, data_connection):
    cursor = data_connection.cursor()
    current_time = get_current_time_to_schema_date()

    tweet_has_media = tweet.media is not None
    tweet_is_quote_retweet = tweet.quoted_status is not None

    tweet_is_reply = int(tweet.in_reply_to_status_id is not None)
    tweet_reply_to_user = tweet.in_reply_to_user_id
    tweet_time = get_twitter_date_to_schema_date(tweet.created_at)

    # Need to validate that the replies are non-empty.
    tweet_replies = get_replies(tweet.user.screen_name, tweet.id_str, config)
    tweet_replies = tweet_replies if tweet_replies is not None else 0

    print(f'[info] Storing {tweet.id_str}...')

    statement = 'SELECT replies FROM tweets WHERE id = ?'

    current_replies = cursor.execute(statement, (tweet.id_str,)).fetchone()

    # We only want to update the number of replies if the result we get from search is
    # larger than what we already have (given the volatility of search results.)
    if current_replies is not None and len(current_replies) > 0 and current_replies[0] is not None:
        if current_replies[0] > tweet_replies:
            tweet_replies = current_replies[0]

    # Captures the tweet itself in a standalone capacity
    statement = 'INSERT OR REPLACE INTO tweets (id, likes, retweets, is_reply, reply_to_user, time_of_tweet, time_of_capture, author_id, location, replies, text, has_media, is_quote_retweet) VALUES (?, ?, ?, ?, ?, ?, ?, ?, ?, ?, ?, ?, ?)'
    cursor.execute(statement, (tweet.id_str, tweet.favorite_count, tweet.retweet_count, tweet_is_reply, tweet_reply_to_user, tweet_time, current_time, tweet.user.id_str, tweet.coordinates, tweet_replies, tweet.full_text, tweet_has_media, tweet_is_quote_retweet))
    data_connection.commit()

    # Captures the tweet snapshot for further analysis
    statement = 'INSERT OR REPLACE INTO tweet_snapshots (id, retweets, likes, replies, time_of_capture) VALUES (?, ?, ?, ?, ?)'
    cursor.execute(statement, (tweet.id_str, tweet.retweet_count, tweet.favorite_count, tweet_replies, current_time))
    data_connection.commit()

    print(f'[info] Stored {tweet.id_str}.')
This function processess each tweet and extracts relevant metadata, such as whether the tweet is a reply to another user or whether it has media attached to it. Think about future uses - you might want to see which tweets perform best under what conditions and having as much metadata that can be used as features to train your prospective ML model is key6.
The one tricky part that I had to deal with here is that the Twitter API does not give you an option to get the number of replies to a tweet. So, I had to use a workaround, by using the Twitter search API7 (that’s the call to get_replies):
def get_replies(user, tweet_id, config):
    print(f'[info] Attempting to get replies for tweet {tweet_id}...')
    twitter_api = get_twitter_instance(config)

    # Ensure that the whole thing is encoded.
    query = f'q=%28to%3A{user}%29%20since_id%3A{tweet_id}'

    while True:
        try:
            results = twitter_api.GetSearch(raw_query=query, count=100)

            reply_results = []

            for result in results:
                if str(result.in_reply_to_status_id) == tweet_id:
                    reply_results.append(result)

            return len(reply_results)
        except twitter.error.TwitterError as rate_error:
            print(f"[error] Hit a rate limit error. {rate_error.message}. Sleeping started at {datetime.now()}...")
            time.sleep(900)
        break
I am using a pre-cooked pattern to search for tweets that are replies, and then check if in_reply_to_status_id matches the tweet ID that I am currently trying to store. Simple!
Once I get the number of replies, back in log_tweet I am making sure that the number that I obtained is larger than the one that I already have - because the search window shifts as the script executes over time, it’s entirely possible that the call is made at some point when the search returns less results to the search query than it did before. I don’t want to overwrite my previously-recorded number of replies, that is likely more accurate. Of course, it’s possible that replies were deleted and the number adjusted to a lower one, but for experimentation purposes this is good enough to get at least the maximum number of replies the tweet reached.
The last step in logging the tweet is actually inserting or replacing the record into two tables - the one with tweets, that has a unique collection of tweets across users, and one that has snapshots of tweets, that allow analyzing their performance over time. The latter does not need all the metadata captured - just an ID and the key engagement metrics around likes, retweets and replies.
And that’s it for the ingress script! As I mentioned, its purpose is rather singular and it doesn’t do much besides just taking the data, massaging it and then making sure that it’s stored accordingly.
You can look at the source of all the components above in the GitHub repository.
Analysis notebook #
Now for the fun part - actually looking at the data! To be able to do this, you should run the ingress script for some time first, so that it accumulates a corpus of data it can analyze. You can just grab the Jupyter Notebook that I put together and repurpose it for your own set of snapshots once you have the data.
Within the notebook, I will once again need to read the configuration file to get information about the data store:
# The config is one level above the notebook folder.
config = configparser.ConfigParser()
config.read('../service.cfg')
config.sections()

userId = '47547933' # Myself (Den)
I am also keeping a user ID handy for future reference, as I am looking up data in various tables. And just like in the ingress script, I also need to have an active connection to the data store:
# Using relative path here because the database is one level above the notebook folder.
data_connection = sqlite3.connect("../" + config['Datastore']['Database'])
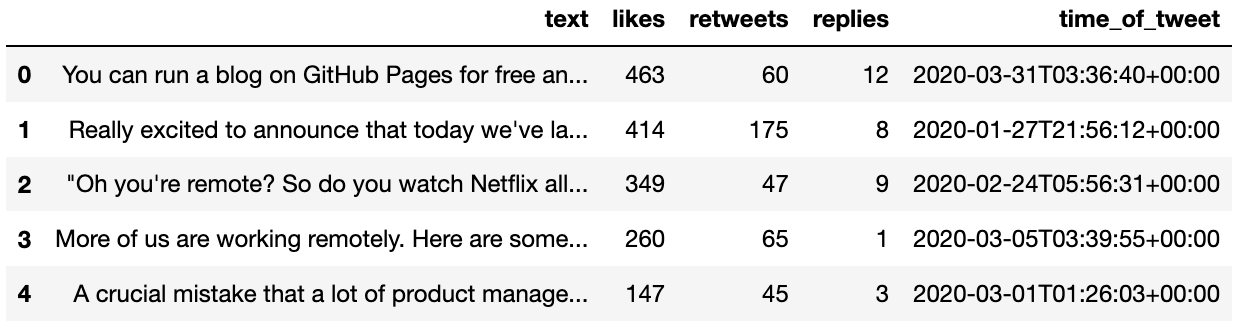
Now, let’s start with a basic query - I want to see my top 5 tweets that are captured in the data store. This can be inspected with the following snippet:
statement = f'SELECT text, likes, retweets, replies, time_of_tweet FROM tweets WHERE author_id = "{userId}" ORDER BY likes DESC'
df = pd.read_sql_query(statement, data_connection)
df.head(5)
The results should resemble something like this:
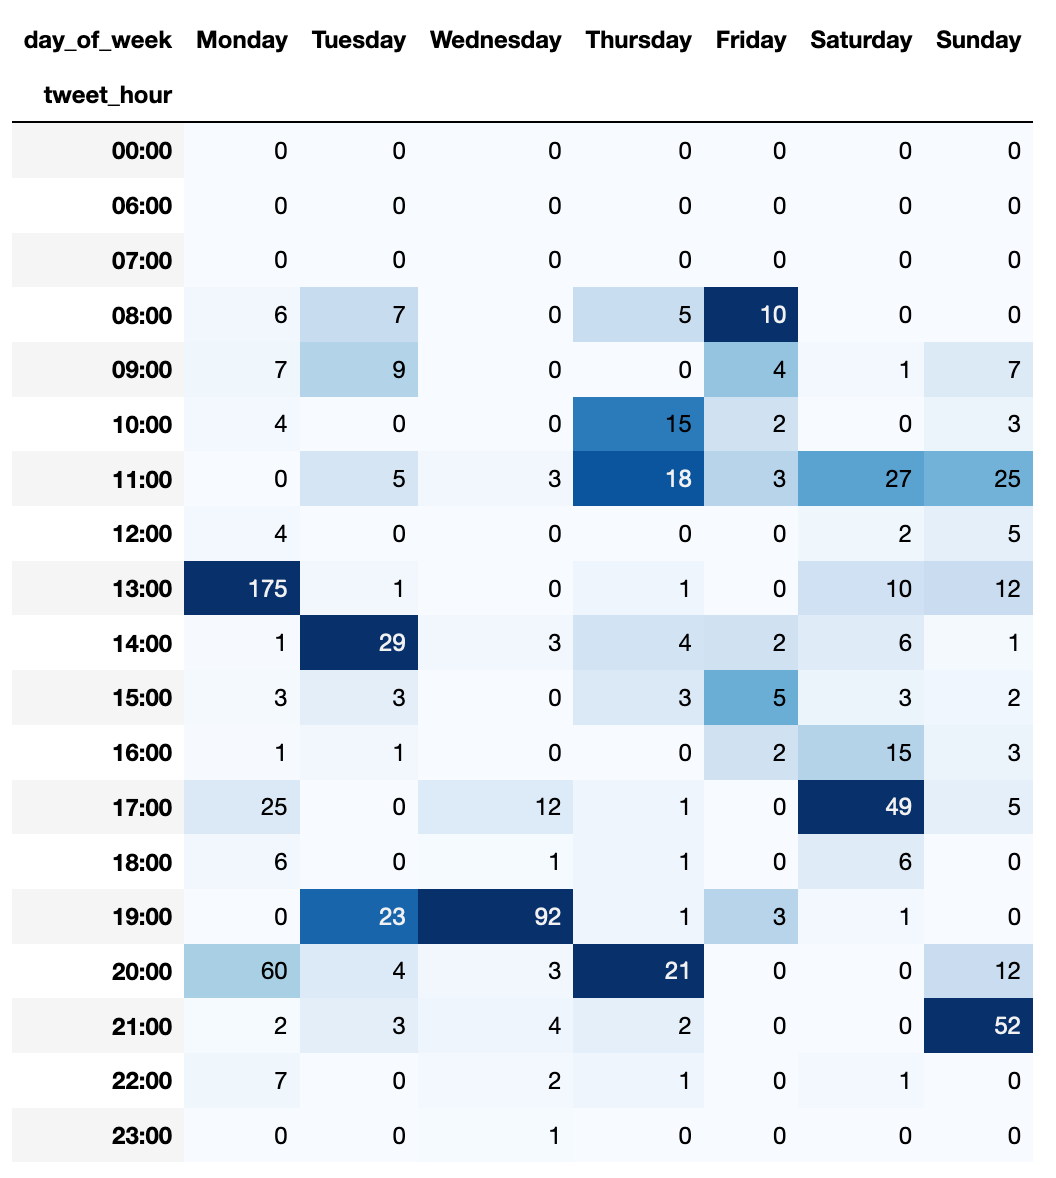
That looks nice! But what if I wanted to now look at the popularity of tweets that I posted, judged by the number of retweets, and aggregated over the day and hour of the day during which those tweets were posted? No problem - here is the snippet:
statement = f"""SELECT sum(retweets) retweets, strftime('%Y-%m-%d', local_time) tweet_date, strftime('%H:00', local_time) tweet_hour FROM (
	SELECT time_of_tweet, retweets, datetime(time_of_tweet, 'localtime') local_time FROM tweets
	WHERE author_id='{userId}'
		AND text NOT LIKE 'RT @%'
	ORDER BY retweets DESC)
GROUP BY tweet_date, tweet_hour"""
df = pd.read_sql_query(statement, data_connection)

pivoted_df = df.pivot(index='tweet_hour', columns='tweet_date', values='retweets')
pivoted_df = pivoted_df.replace(np.nan,0)
pivoted_df.style.background_gradient(cmap='Blues')
Notice that in the WHERE clause, I am specifying that I do not want to get tweets that have their text starting with RT @. That is because every tweet of that format is a retweet of another tweet rather than an original. I don’t really care for tracking the performance for those.
Running the snippet above should give you a colored data frame, with shades of blue telling you the times with most retweets:
That’s cool and all, as it shows the breakdown of engagement over a time period. But what if I wanted to see the same data in aggregate by day of week instead of individual dates? SQL to the rescue:
statement = f"""SELECT sum(retweets) retweets, case cast (strftime('%w', local_time) as integer)
  when 0 then 'Sunday'
  when 1 then 'Monday'
  when 2 then 'Tuesday'
  when 3 then 'Wednesday'
  when 4 then 'Thursday'
  when 5 then 'Friday'
  else 'Saturday' end as day_of_week, strftime('%H:00', local_time) tweet_hour FROM (
	SELECT time_of_tweet, retweets, datetime(time_of_tweet, 'localtime') local_time FROM tweets
	WHERE author_id='{userId}'
		AND text NOT LIKE 'RT @%'
	ORDER BY retweets DESC)
GROUP BY day_of_week, tweet_hour"""
df = pd.read_sql_query(statement, data_connection)

pivoted_df = df.pivot(index='tweet_hour', columns='day_of_week', values='retweets')
pivoted_df = pivoted_df[['Monday', 'Tuesday', 'Wednesday', 'Thursday', 'Friday', 'Saturday', 'Sunday']]
pivoted_df = pivoted_df.replace(np.nan,0)
pivoted_df.style.background_gradient(cmap='Blues')
By using a built-in constant that represents the week day and then transforming that to a string representation, I can then use the data to render the data frame like this:
This is intersting to look at as you can see the times of tweeting that result in most retweets. Before I get further, keep in mind that all of the insights you get here are correlative rather than causal - just because you posted something at 8AM with a lot of retweets doesn’t mean that you should post everything at 8AM. It very well could be that one tweet happened to reach quick popularity because someone retweeted it shortly after you posted it, that would otherwise not look at your content. So take the data with a boulder of salt until you can run an in-depth analysis of it.
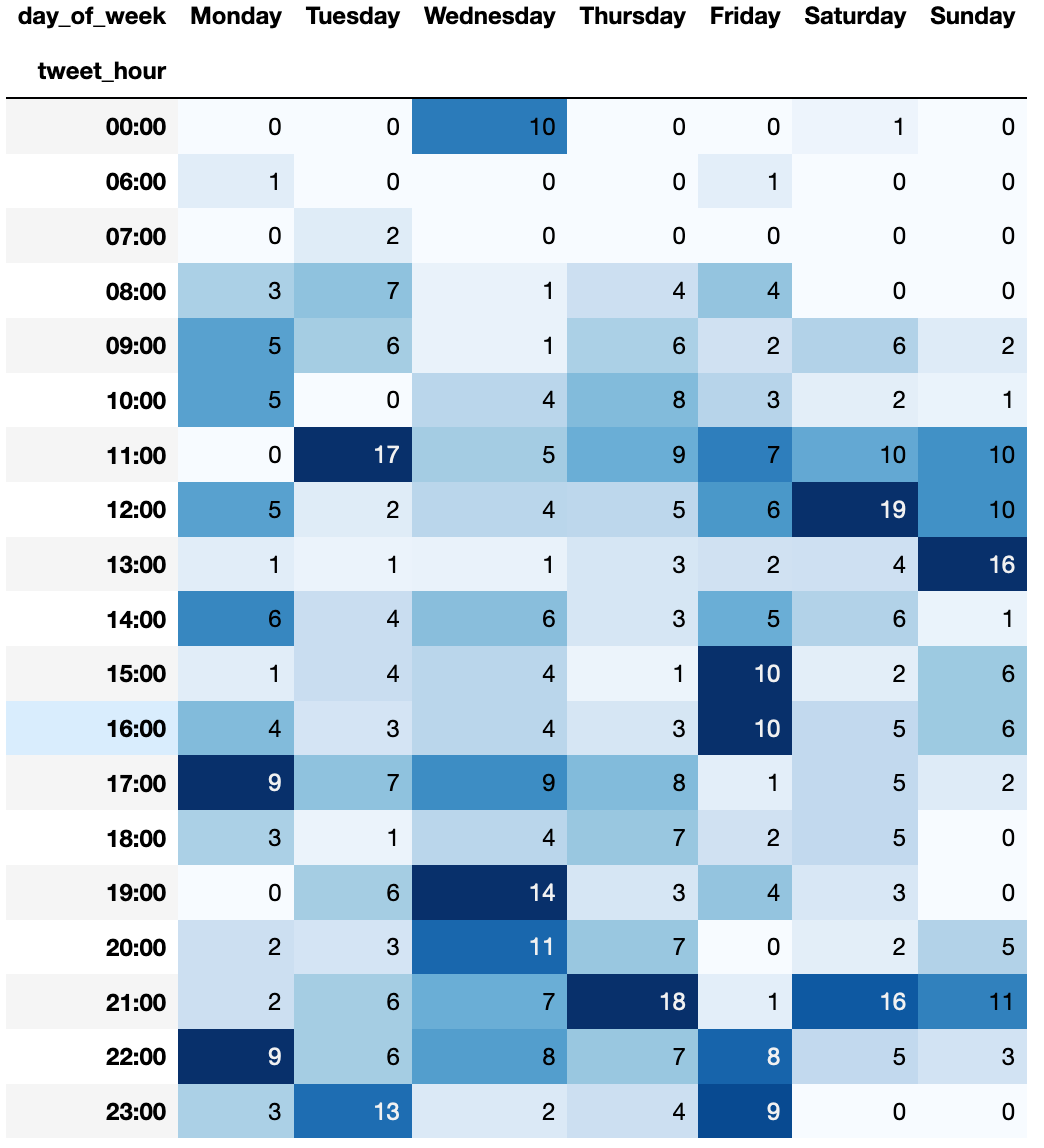
A similar approach to rendering data can be used to understand when a user tweets the most. To do that, we can adjust the SQL query to aggregate the count by time and day:
statement = f"""SELECT count(*) total_tweets, case cast (strftime('%w', local_time) as integer)
  when 0 then 'Sunday'
  when 1 then 'Monday'
  when 2 then 'Tuesday'
  when 3 then 'Wednesday'
  when 4 then 'Thursday'
  when 5 then 'Friday'
  else 'Saturday' end as day_of_week, strftime('%H:00', local_time) tweet_hour FROM (
	SELECT time_of_tweet, datetime(time_of_tweet, 'localtime') local_time FROM tweets
	WHERE author_id='{userId}'
		AND text NOT LIKE 'RT @%'
	ORDER BY time_of_tweet DESC)
GROUP BY day_of_week, tweet_hour"""
df = pd.read_sql_query(statement, data_connection)

pivoted_df = df.pivot(index='tweet_hour', columns='day_of_week', values='total_tweets')
pivoted_df = pivoted_df[['Monday', 'Tuesday', 'Wednesday', 'Thursday', 'Friday', 'Saturday', 'Sunday']]
pivoted_df = pivoted_df.replace(np.nan,0)
pivoted_df.style.background_gradient(cmap='Blues')
And once again, you will get an easy-to-understand data frame:
Lastly, I want to mention how you can use the data that you collect to track the fluctuations in follower and following counts. It’s a much easier process than any of the queries above. All you need to do is get the list of snapshots for a user and then plot them:
statement = f'SELECT follower_count, following_count, time_of_capture FROM user_snapshots WHERE user_id = "{userId}"'
df = pd.read_sql_query(statement, data_connection)
plt.plot(df.time_of_capture, df.follower_count)
This will give you a graph that resembles the one in the screenshot below:
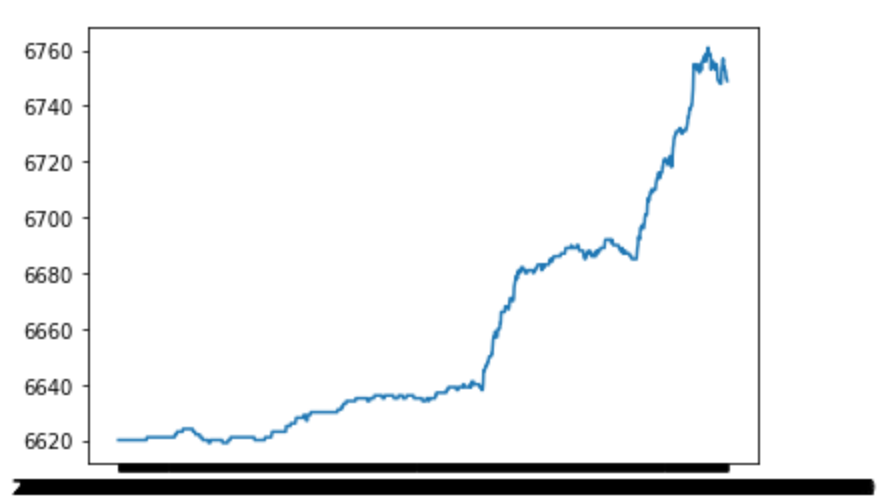
The X axis is a bit hard to read because I am plotting every single snapshot that I have. To avoid this problem, you can pre-aggregate the records. For example, you could group them by day:
statement = f"""SELECT * FROM (
SELECT
	last_value(follower_count)
	OVER (
		PARTITION BY target_date
	) followers,
	last_value(following_count)
	OVER (
		PARTITION BY target_date
	) following,
	target_date
FROM (
	SELECT
		strftime('%Y-%m-%d', time_of_capture) target_date,
		following_count,
		follower_count
	FROM
		(SELECT
			*
		FROM
			user_snapshots
		WHERE
			user_id = '{userId}'
		ORDER BY time_of_capture))
) GROUP BY target_date, followers, following
"""
df = pd.read_sql_query(statement, data_connection)
df.head()

plt.xticks(rotation='vertical')
plt.plot(df.target_date, df.followers)
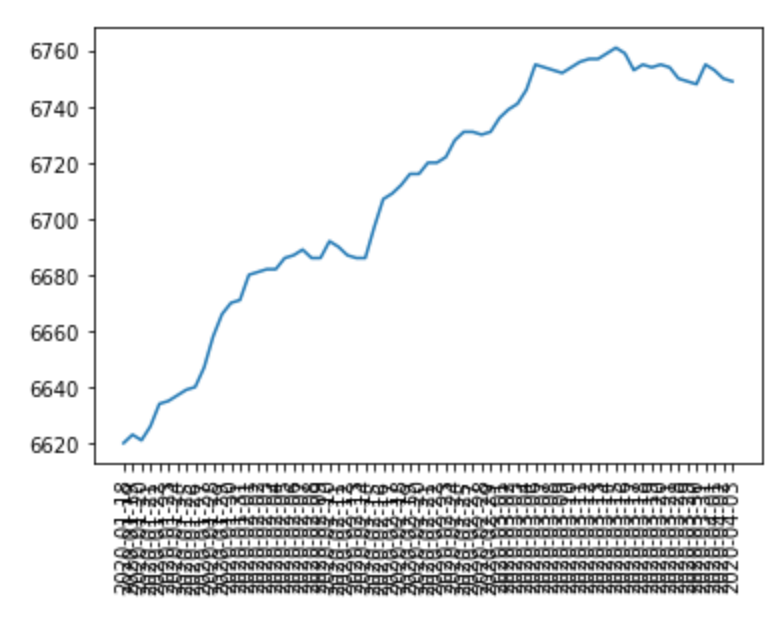
Notice that I am not taking the maximum number for each day - that would be incorrect, since follower or following counts can fluctuate up or down. Instead, I partition the data by date, and then take the last record available for a given date for the user. That is the true “end of day” snapshot for the audience a user has. This will also make the graph a bit less packed:
Conclusion #
As you can see, with a little bit of effort and access to the Twitter API (or a scraper), you can start analyzing your own data and make an informed decision of what generates the most impact for your Twitter account. The project described above is not an end-to-end solution that can provide you super-interesting insights in one click, but it’s a stepping stone. Once you have more data, you will be able to train a model and get an assessment of sentiment that resonates most with your audience. Similarly, you can build a bunch of machine learning goodness that would allow you to predict the popularity of any given tweet given the wealth of information you store.
-
See the SQLite documentation. ↩︎
-
The Flask project has two components - the API and the UI. ↩︎
-
See Stack Overflow for what
__main__.pyis. ↩︎ -
If it does happen, you will need to re-write the branch history. Treat all keys that were checked in, even for a minute, as compromised. You absolutely need to revoke and re-generate them. ↩︎
-
See official Twitter API documentation (no longer available). ↩︎
-
Not every feature is created equal, and some likely will have more weight than others, but you don’t know yet which features are key to analysis, therefore you want to collect as many variations as possible to get a reliable sample. ↩︎
-
See official documentation (no longer available). ↩︎