Building The OpenSpartan Data Browser
Earlier this year I bootstrapped a project called OpenSpartan. Its intent is to primarily fill a gap for those that want to tap into Halo Infinite data - the developers that build tools such as Halo Data Hive and others. As part of this work I stumbled across an interesting piece of data - every game mode and map, when queried through the Halo Infinite API, would return some rudimentary telemetry data, showing the number of recent and all-time plays, along with number of ratings, bookmarks, and average rating. That information was not exposed anywhere in the game, short of ratings themselves and a quick view of plays which were available in the overview pages for specific game modes or maps.
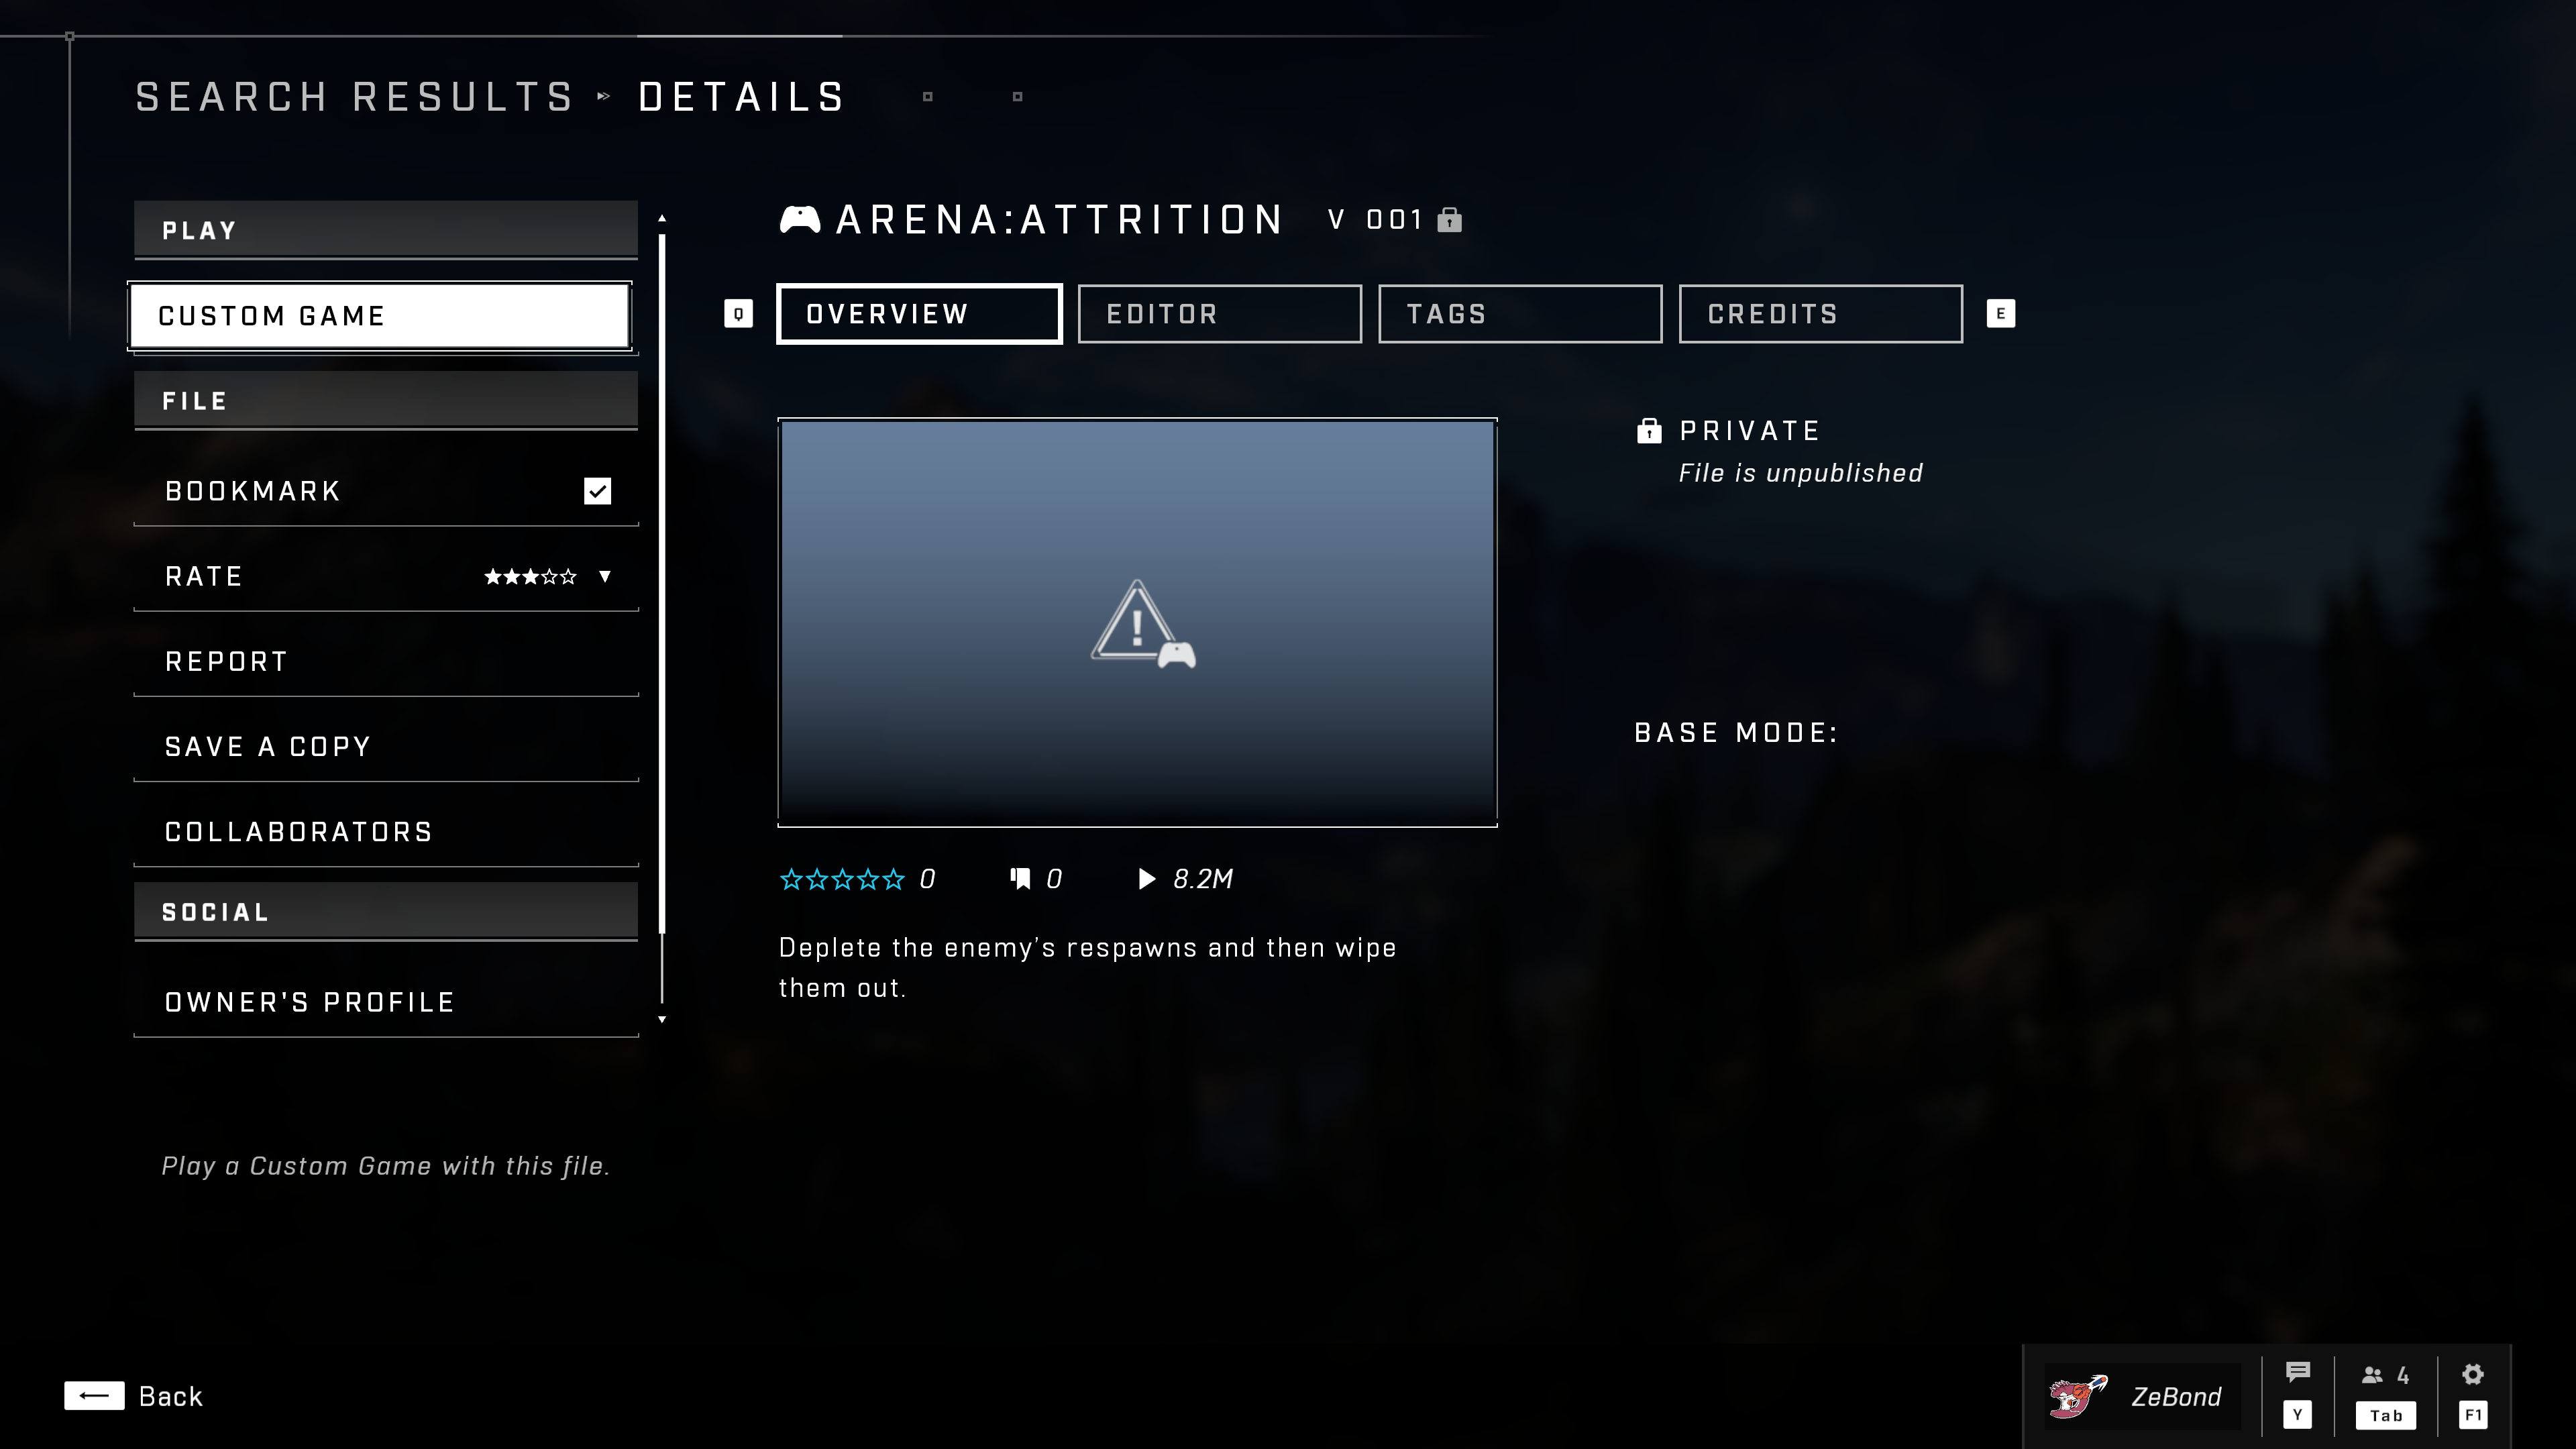
More than that, said information was always a point in time reference. That is, if you make an API call and see what the data is, you will only have that moment to compare against because the API would not provide historical records of map and game mode performance.
To make an improvement to this specific part of the experience, I’ve decided to bootstap a new GitHub repository, called openspartan-data-snapshots which would be responsible for two things:
- Give me a historical record of the stats. That would be done by using a tool called
statlink(which in turn relies on Grunt, the open source Halo API library) that would produce regular snapshots of all available maps and game modes. - Providing the data source for the data API. This would enable me to easily query the data on-demand and present it in whatever form I prefer.
Initially, to get to some minimal working state, I would have charts auto-generated within the repository itself with a custom GitHub Action that I built. However, that became a pretty cumbersome task not the least because producing one-off charts and then updating the README.md with the multitude of versions of maps and game modes was unwieldy and the entire experience would feel bloated and hard to navigate.
This is when the idea struck me - this needs to be a website. Given that I already had the data (I’ve been collecting it for close to six months), all I would technically need to do is find a way to display it within a web page. I wanted that web page to be snappy too, so no convoluted requests or renders. Because I was working at Netlify, my initial hunch was “I wonder if I can make this a static site.” But hold on a second, if the data is changing frequently, what does it really mean for the site to be static?
In this context, I wanted to regularly re-generate all pages with graphs for each version of the map and game mode but serve them as static HTML. Because my data is “lagging” (it updates every 15 minutes), I didn’t need to really update every single page in real-time - I could have a scheduled trigger of some kind that would do it for me.
All of this led me down the path of building a Next.js application that queried the data API at build time and produced fancy charts in the output. There are several special considerations here that are worth calling out:
- When the application is built, both map and game variant asset IDs are dynamically generated. Notice that in the repoistory itself there are no map-specific IDs. This is leveraging the Next.js dynamic routes capability which gives me a chance to pre-compute the paths during the build. The structure of the URL will ultimately become
/[asset_class]/[asset_id]/[asset_version]. - For each path, the charts are dynamically-generated SVGs. This is accomplished with the help of d3js. And because you can’t use d3js without a browser, my implementation also relies on JSDom (during builds there is no browser). I really wanted to avoid having to compute the chart on the client due to performance sacrifices.
- Netlify doesn’t have scheduled builds. What this means, however, is that I can use scheduled functions (see the code in
rebuild.ts) to trigger a build hook which will, upon completion, deploy the latest and greatest version of the data.
What ended up happening is that now I have a relatively performant website that enables me to quickly take a peek at the various map and game mode stats without manual intervention or trying to parse TSV files in the repo or through a Jupyter notebook.
There are a few implements that I still need to make, especially when it comes to computing the SVG data (right now it’s a brute-ish way of passing SVG HTML), but overall this turned out to be a very useful tool in analyzing when specific maps or games modes spike in usage. And looking at historical data is now easier than ever!